WinUI Linear Gauge Overview
9 Jul 20261 minute to read
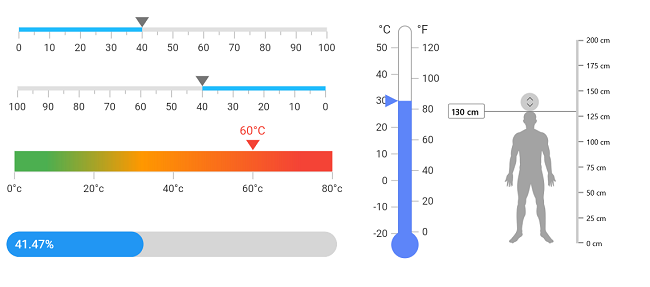
The WinUI Linear Gauge control is a multipurpose data visualization control that displays numerical values on a linear scale horizontally or vertically.
Key Features
- Orientation - The Linear Gauge can be oriented vertically or horizontally.
- Axis - The Linear Gauge axis is a scale where a set of values is plotted. Axis elements, such as labels, major ticks, and minor ticks, can be customized.
- Ranges - The Linear Gauge range is a visual element that helps you quickly visualize where a range falls on the axis track. Multiple ranges with different styles can be added to a gauge.
- Pointers - The Linear Gauge pointer is used to indicate a specific value on the axis. The control has three types of pointers: shape marker pointer, content marker pointer, and bar pointer. All the pointers can be customized as needed. You can add multiple pointers in a single gauge.
- Pointer animation - The Linear Gauge can animate the pointer in a visually appealing way when the pointer moves from one value to another.
- Pointer interaction - The Linear Gauge provides an option to drag a pointer from one value to another to change the value at runtime.
NOTE
You can get the samples in the GitHub link.