Multiple panes
13 Jun 20235 minutes to read
Chart area can be divided into multiple panes using the RowDefinitions and ColumnDefinitions properties.
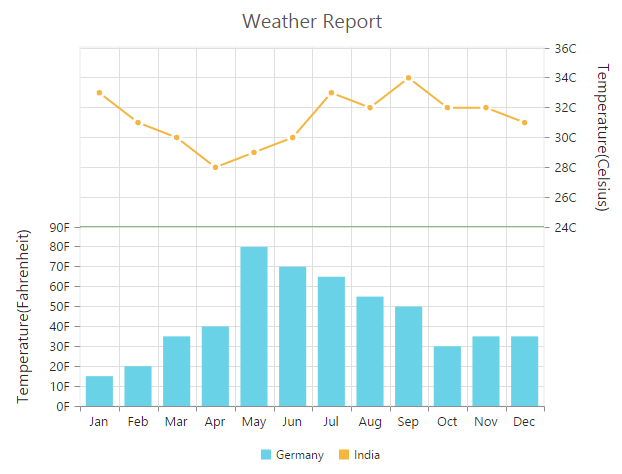
Row Definitions
To split the chart area vertically into a number of rows, use RowDefinitions of the chart.
-
You can allocate space for each row by using the Unit option that determines whether the chart area should be split by percentage or pixels for the given RowHeight value of the RowDefinitions.
-
To associate a vertical axis to a row, specify the RowDefinitions Index value to the RowIndex property of the chart axis.
-
To customize each row’s horizontal line, use LineColor and LineWidth property.
@(Html.EJ().Chart("chartContainer")

      // ...
      //  Splitting chart area into multiple rows
      .RowDefinitions(rd =>
      {
          rd
              //  Split first row of the chart area
              .Unit("percentage").LineColor("Gray").LineWidth(0).RowHeight(50).Add();
          //  Split second row of the chart area
          rd.Unit("percentage").LineColor("green").LineWidth(0).RowHeight(50).Add();
      })
      .Axes(ax =>
      {
          //Create secondary axis and bind it to second row of chart area
          ax.Name("yAxis1")
          .RowIndex(1).Add();
      })
      .Series(sr =>
      {
          sr
              //Binding vertical axis name
              .YAxisName("yAxis1").Add();
      })
        //...
 )
Click here to view the online demo sample for multiple panes.
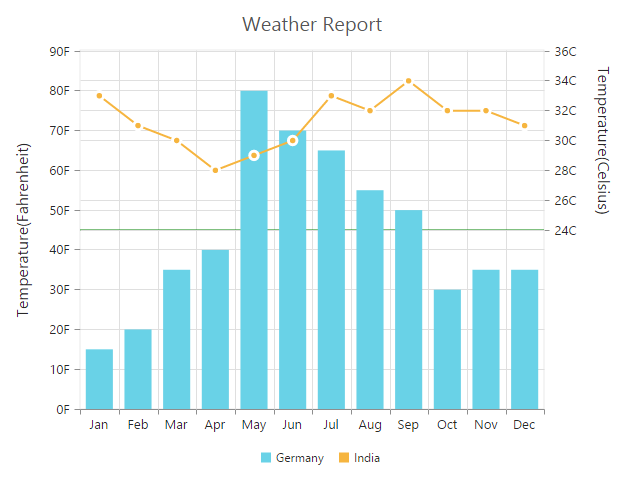
Row Span
For spanning the vertical axis along multiple panes vertically, you can use RowSpan property of axis.
@(Html.EJ().Chart("chartContainer")

      // ...
        //  Splitting chart area into multiple rows
      .RowDefinitions(rd =>
      {
         //...
      })
      .Axes(ax =>
      {
         //..
      })
      .PrimaryYAxis(pry=>pry
          //  Span the PrimaryYAxis
          .RowSpan(2)
          )
      .Series(sr =>
      {
         //...
      })
        //...
 )
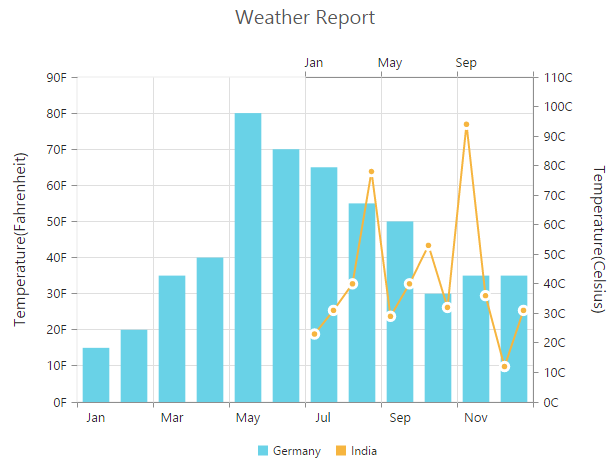
Column Definitions
To split the chart area horizontally into a number of columns, use ColumnDefinitions of the chart.
-
You can allocate space for each column by using the Unit option that determines whether the chart area should be split by percentage or pixels for the given ColumnWidth value of the ColumnDefinitions.
-
To associate a horizontal axis to a column, specify the ColumnDefinitions Index value to the ColumnIndex property of the chart axis.
@(Html.EJ().Chart("chartContainer")

      // ...
        //  Splitting chart area into multiple columns
      .ColumnDefinitions(cdn =>
      {

              //  Split first column of the chart area
              .Unit("percentage").ColumnWidth(50).Add();
          //  Split second column of the chart area
          cdn.Unit("percentage").ColumnWidth(50).Add();
      })

      .Axes(ax =>
      {
          //Create secondary axis and bind it to second row of chart area
          ax.Name("xAxis1")
          .ColumnIndex(1).Add();
      })
      .Series(sr =>
      {
          sr
              //Binding horizontal axis name
              .XAxisName("xAxis1").Add();
      })
        //...
 )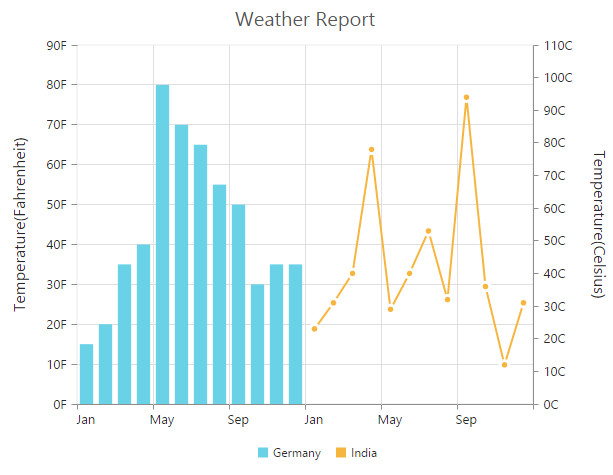
Column Span
For spanning the horizontal axis along multiple panes horizontally, you can use ColumnSpan property of axis.
@(Html.EJ().Chart("chartContainer")

      // ...
      //  Splitting chart area into multiple columns
      .ColumnDefinitions(cdn =>
      {
        //...
      })
      .PrimaryXAxis(axis=>axis
          //  Span the PrimaryXAxis
          .Name("xAxis1").ColumnSpan(2)
          )
      .Axes(ax =>
      {
          //...
      })
      .Series(sr =>
      {
         //...
      })
        //...
 )