How can I help you?
Annotations
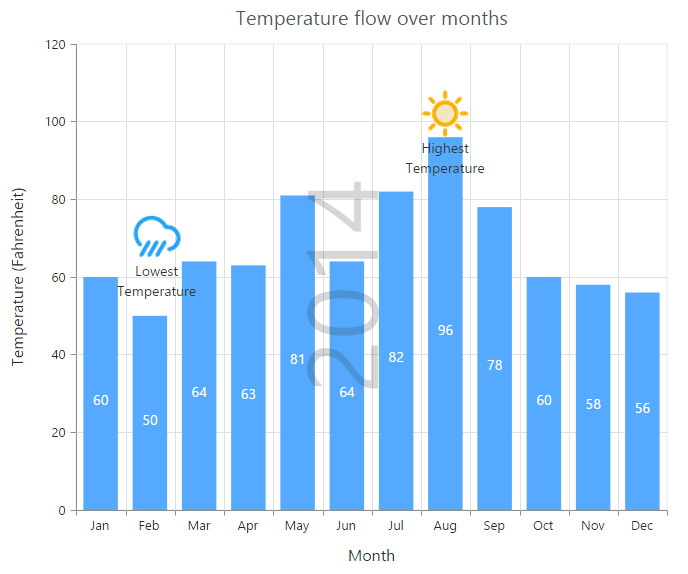
annotations are used to mark the specific area of interest in the chart area with texts, shapes or images.
You can add annotations to the chart by using the Annotations option. By using the Content option of annotation object, you can specify the id of the element that needs to be displayed in the chart area.
<div id= "watermark" style="font-size:100px; display:none">2014</div>
<div>
@(Html.EJ().Chart("chartContainer")

    .Annotations(an => {
        //Add Annotation content here
        an.Visible(true).Content("watermark").Opacity(0.2).Region(Region.Series).Add();
    })
        // ...
    )
</div>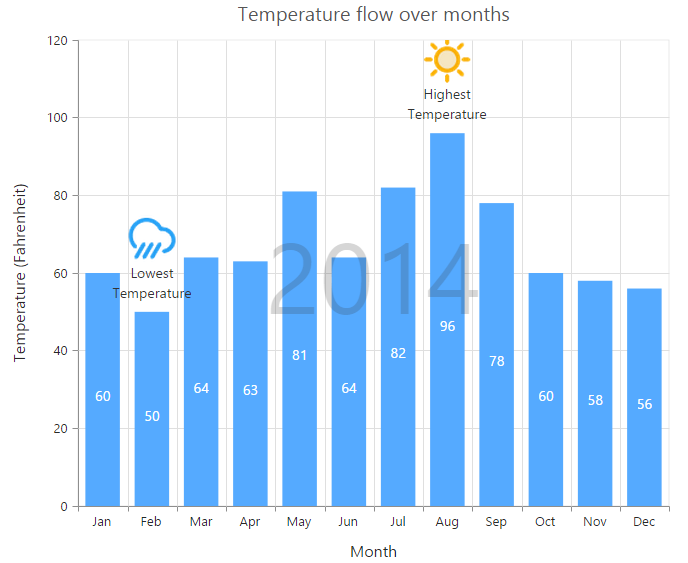
Click here to view the Annotations online demo sample.
NOTE
Annotations are not supported in 3D chart types.
Rotate the annotation template
To rotate the annotation template, you can use the Angle property of the annotations.
@(Html.EJ().Chart("chartContainer")

    .Annotations(an => {
        an.Visible(true)
        // ...
        //Rotate the Annotation template
        .Angle(270).Add();
    })
        // ...
    )
Positioning Annotation
You can position annotations either by using the coordinates (X and Y) options or by using the alignment options HorizontalAlignment and VerticalAlignment.
By using the CoordinateUnit option, you can specify whether the value provided in the X and Y options are relative to the chart or axis.
-
If the CoordinateUnit is set to None, the annotations are placed relative to the chart/plot area by using the HorizontalAlignment and VerticalAlignment options.
-
If the coordinateUnit is set to points, the x and y values of the annotation are the coordinates relative to the axis and annotation is positioned relative to the axis. By default, the x and y values are associated with the PrimaryXAxis and PrimaryYAxis. In case, when the chart contains multiple axis and you want to associate the annotation with a particular axis, you can specify the XAxisName and YAxisName options of the annotation object.
-
If the coordinateUnit is set to Pixels, the X and Y values are coordinates relative to the top-left corner of the chart/plot area.
NOTE
By using the Region option, you can specify whether the annotation is placed relative to the entire chart or plot area.
@(Html.EJ().Chart("chartContainer")

    .Annotations(an => {
        an.Visible(true)
        // ...
            //Change coordinateUnit type to pixels
        .CoordinateUnit(CoordinateUnit.Pixels).X(170).Y(350).Add();
    })
        // ...
    )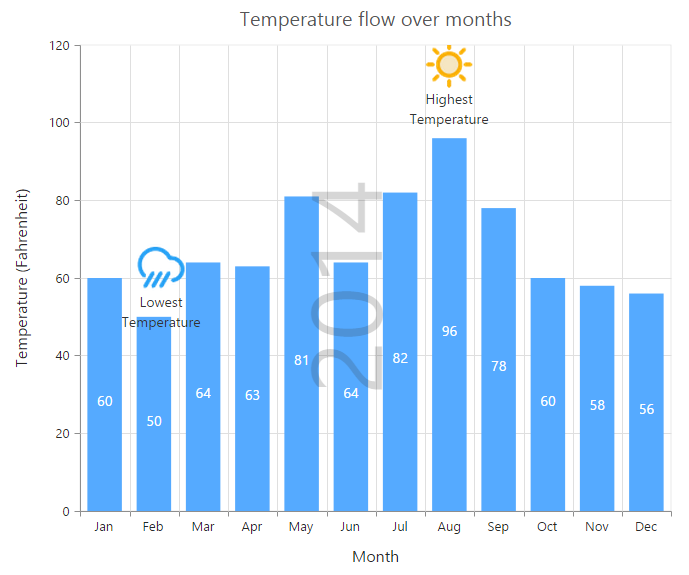
Annotation alignments
When the coordinateUnit is set to pixels or points, you can align the annotation relative to the coordinates by using the HorizontalAlignment and VerticalAlignment options.
@(Html.EJ().Chart("chartContainer")

    .Annotations(an => {
        an.Visible(true)
        // ...
            //Change alignment of annotation template
        .VerticalAlignment(VerticalAlignment.Middle).HorizontalAlignment(HorizontalAlignment.Left)
        .Margin(mr=>mr.Right(40)).Add();
    })
        // ...
    )