Series
28 Sep 20171 minute to read
Series Point customization
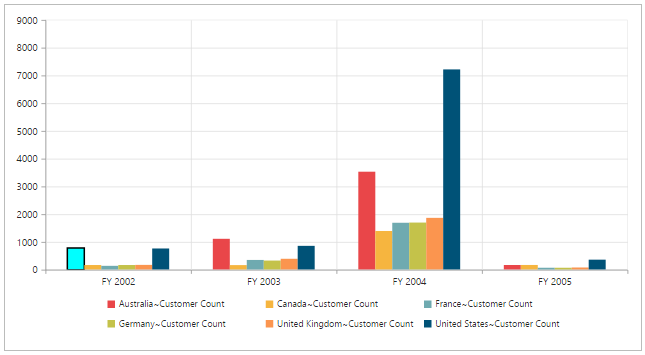
By using the fill and border properties of Chart series, you can customize the PivotChart series color, border color and border width.
<ej-pivotchart [commonSeriesOptions]="commonSeriesOptions" [size]="size" (load)="onLoad($event)">
</ej-pivotchart>
//..
export class PivotChartComponent {
public size; commonSeriesOptions;
constructor() {
//..
this.size = { height: "460px", width: "950px" };
this.commonSeriesOptions = { type: ej.PivotChart.ChartTypes.Column };
}
onLoad(args) {
args.model.seriesRendering = function (evt) {
this.model.series[0].points[0].fill = "aqua";
this.model.series[0].points[0].border = {
color: "black",
width: 2
};
};
};
}