How can I help you?
Multiple Axes
You can split the pivot chart and its area into multiple panes to draw multiple series with multiple axes. Additional vertical/horizontal axes in the pivot chart can be created by the axes property.
Before rendering multiple axes in the pivot chart, you should know some important properties of axes and series of the pivot chart.
Properties of axes
- rowIndex: Specifies the index of the row where the axis is associated.
- columnIndex: Specifies the index of the column where the axis is associated.
- opposedPosition: Specifies whether to render the axis at the opposite side of its default position.
- labelFormat: Provides custom formatting for axis label and supports all standard formatting types of numerical and date time values.
-
title: You can customize the title of the axis by the following properties.
* enableTrim: Specifies whether to trim the axis title when it exceeds the chart area or the maximum width of the title.
* maximumTitleWidth: When the title exceeds the maximum width, the title gets trimmed by setting enableTrim to true.
* visible: Controls the visibility of the axis title. - name: Unique name of the axis. To associate an axis with the series, you have to set this name to the xAxisName/yAxisName property of the series.
To know more about axes properties, Click Here
Properties of series
- xAxisName: Specifies the name of the X-axis that has to be associated with this series. Add an axis instance with this name to axes collection.
- yAxisName: Specifies the name of the Y-axis that has to be associated with this series. Add an axis instance with this name to axes collection.
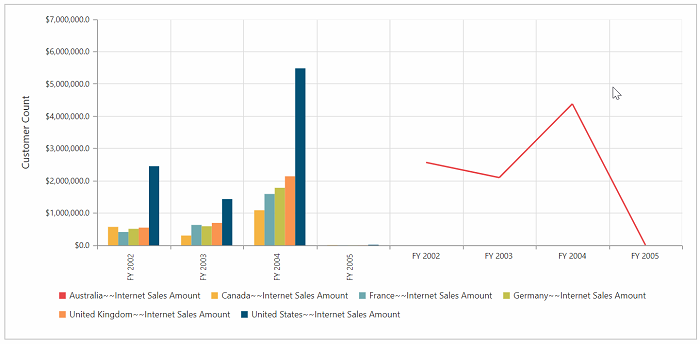
Customizing axes at row index of zero
You can customize the axes in the primary pivot chart itself. To achieve this, you should give the following properties:
<ej-pivotchart [axes]="axes" (beforeSeriesRender)="onBeforeRender($event)">
</ej-pivotchart>
//..
export class PivotChartComponent {
public axes;
constructor() {
//..
this.axes = [{
rowIndex: 0,
name: 'yAxisConfig',
//…
}];
}
function onBeforeRender(args) {
for (var i = 0; i < args.series.length; i++) {
if (args.series[i].name.indexOf("Australia") != -1) {
args.series[i].yAxisName = "yAxisConfig";
args.series[i].type = "line";
}
}
return args;
}
}
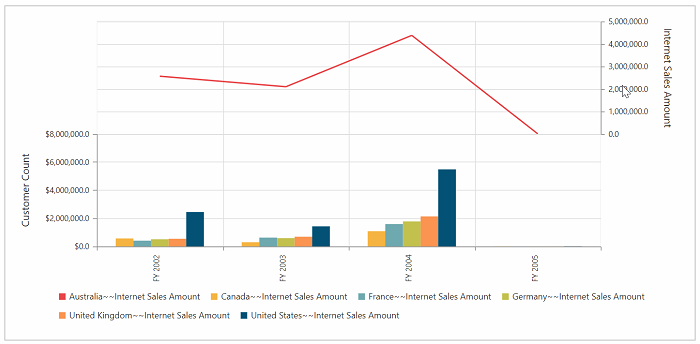
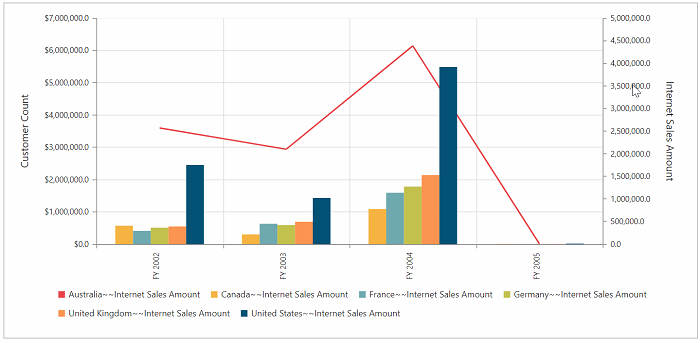
Customizing axes at row index one
<ej-pivotchart [axes]="axes" (beforeSeriesRender)="onBeforeRender($event)">
</ej-pivotchart>
//..
export class PivotChartComponent {
public axes;
constructor() {
//..
this.axes = [{
rowIndex: 1,
name: 'yAxisConfig',
//…
}];
}
function onBeforeRender(args) {
for (var i = 0; i < args.series.length; i++) {
if (args.series[i].name.indexOf("Australia") != -1) {
args.series[i].yAxisName = "yAxisConfig";
args.series[i].type = "line";
}
}
return args;
}
}
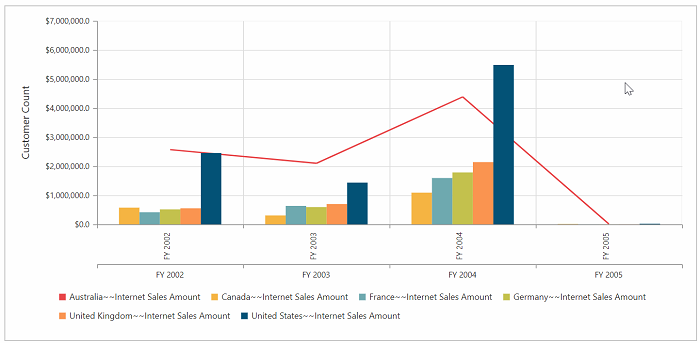
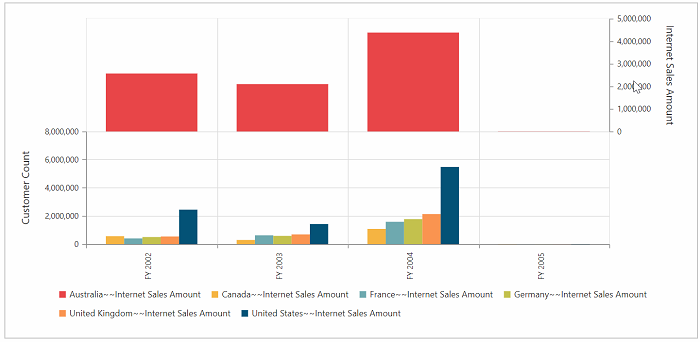
Customizing axes at column index of zero
<ej-pivotchart [axes]="axes" (beforeSeriesRender)="onBeforeRender($event)">
</ej-pivotchart>
//..
export class PivotChartComponent {
public axes;
constructor() {
//..
this.axes = [{
columnIndex: 0,
name: 'xAxisConfig',
//…
}];
}
function onBeforeRender(args) {
for (var i = 0; i < args.series.length; i++) {
if (args.series[i].name.indexOf("Australia") != -1) {
args.series[i].xAxisName = "xAxisConfig";
args.series[i].type = "line";
}
}
return args;
}
}
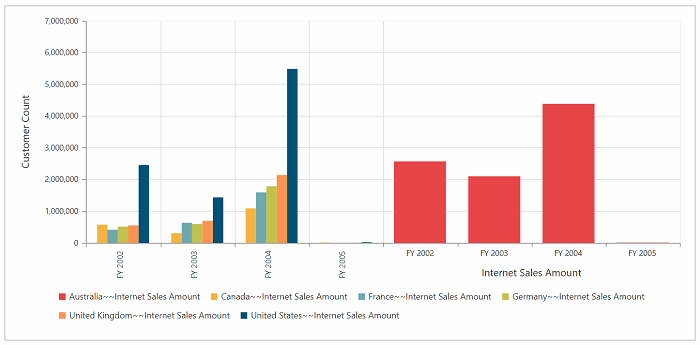
Customizing axes at column index of one
<ej-pivotchart [axes]="axes" (beforeSeriesRender)="onBeforeRender($event)">
</ej-pivotchart>
//..
export class PivotChartComponent {
public axes;
constructor() {
//..
this.axes = [{
columnIndex: 1,
name: 'xAxisConfig',
//…
}];
}
function onBeforeRender(args) {
for (var i = 0; i < args.series.length; i++) {
if (args.series[i].name.indexOf("Australia") != -1) {
args.series[i].xAxisName = "xAxisConfig";
args.series[i].type = "line";
}
}
return args;
}
}
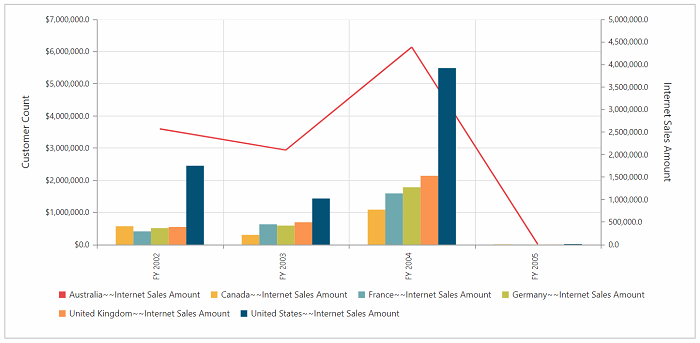
Customizing series
You can customize the series in multiple axes support with the help of beforeSeriesRender event. You can change the series type through the onBeforeRender event.
<ej-pivotchart [axes]="axes" (beforeSeriesRender)="onBeforeRender($event)">
</ej-pivotchart>
//..
export class PivotChartComponent {
public axes;
constructor() {
//..
this.axes = [{
name: 'yAxisConfig',
//…
}];
}
function onBeforeRender(args) {
for (var i = 0; i < args.series.length; i++) {
if (args.series[i].name.indexOf("Australia") != -1) {
args.series[i].yAxisName = "yAxisConfig";
args.series[i].type = "line";
}
}
return args;
}
}Note: You have to use the same name in both name property of axes and xAxisName/yAxisName property of series in the above beforeSeriesRender event.
To learn more about series properties, click here.
Multiple axes support by series index
You can render the pivot chart with multiple axes by series index.
Note: This is the default behavior of multiple axes support, if you are not triggering the beforeSeriesRender event.
<ej-pivotchart [axes]="axes">
</ej-pivotchart>
export class PivotChartComponent {
public axes;
constructor() {
//..
this.axes = [{
{
name:'y:0' // you can create separate y axes for the series which you want
// y indicates(yAxisName) axis in which series needs to be added.
// 0 indicates the series index of pivot chart.
// you can also use pass multiple series index separated by comma(y:0,2)
},
{
name:'x:1'//you can create separate x axes for the series which you want
// x indicates(xAxisName) axis in which series needs to be added.
// 0 indicates the series index of pivot chart.
// you can also use pass multiple series index separated by comma(x:0,2)
}
}];
}
}For Y-axes
export class PivotChartComponent {
    public axes;
    constructor() {
      //..
      this.axes = [{
            name:'y:0'
        }];
      }
   }
For X-axes
export class PivotChartComponent {
    public axes;
    constructor() {
      //..
      this.axes = [{
            name:'x:0'
        }];
      }
   }
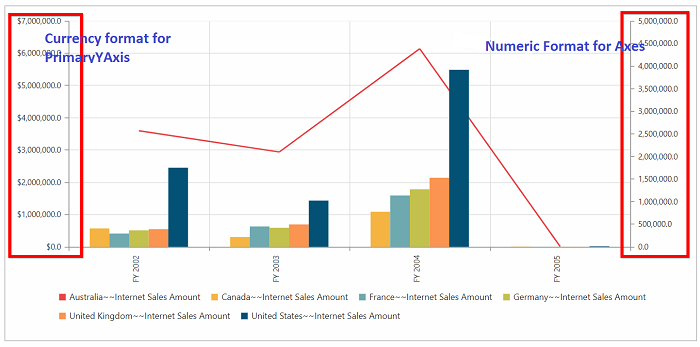
Customizing PrimaryYAxis and axes properties
labelFormat
You can customize the labelFormat for both PrimaryYAxis and custom axes.
export class PivotChartComponent {
    public primaryYAxis, axes;
    constructor() {
      //..
      this.axes = [{
            //…
            labelFormat:'n1'
        }];
      this.primaryYAxis = { labelFormat: 'c1' }
      }
   }
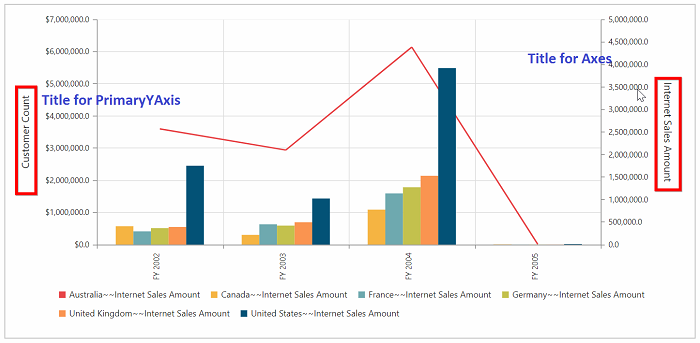
title
You can customize the title for axes by the title property.
export class PivotChartComponent {
    public primaryYAxis, axes;
    constructor() {
      //..
      this.axes = [{
            //…
            title: {text: "Internet Sales Amount"}
        }];
      this.primaryYAxis = { title: { text: "Customer Count" }}
      }
   }