Multiple panes
7 Jun 20174 minutes to read
Chart area can be divided into multiple panes using the rowDefinitions and columnDefinitions properties.
Row Definitions
To split the chart area vertically into a number of rows, use rowDefinitions of the chart.
-
You can allocate space for each row by using the
unitoption that determines whether the chart area should be split by percentage or pixels for the givenrowHeightvalue of the rowDefinitions. -
To associate a vertical axis to a row, specify the rowDefinitions index value to the
rowIndexproperty of the chart axis. -
To customize each row’s horizontal line, use
lineColorandlineWidthproperty.
this.rowDefinitions = [{
    //  Split first row of the chart area
    unit: 'percentage',
    lineColor: 'Gray',
    rowHeight: 50,
    linewidth: 0
}, {
    //  Split second row of the chart area
    unit: 'percentage',
    lineColor: 'green',
    rowHeight: 50,
    linewidth: 0
}];
this.axes = [{
    //Create secondary axis and bind it to second row of chart area
    name: "yAxis1",
    rowIndex: 1
}];<ej-chart id="chartcontainer" [rowDefinitions]="rowDefinitions" [axes]="axes">
<e-seriescollection>
<!--Binding vertical axis name-->
<e-series yAxisName="yAxis1">
</e-series>
</e-seriescollection>
</ej-chart>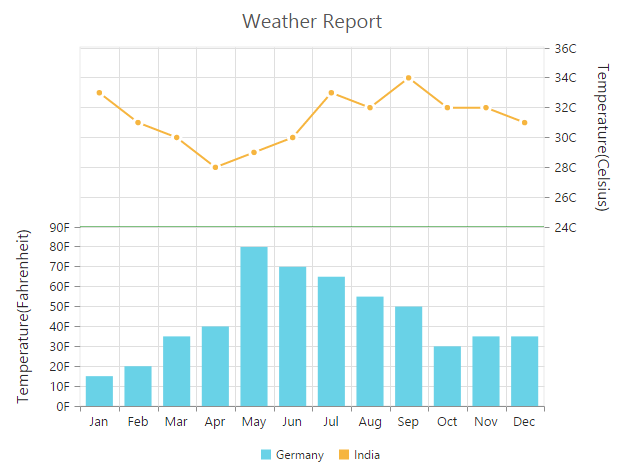
Row Span
For spanning the vertical axis along multiple panes vertically, you can use rowSpan property of axis.
<ej-chart id="chartcontainer" [rowDefinitions]="rowDefinitions" [axes]="axes" [primaryYAxis.rows]=2>
       <e-seriescollection>
          <!--Binding vertical axis name-->
          <e-series yAxisName="yAxis1">
          </e-series>
      </e-seriescollection>
</ej-chart>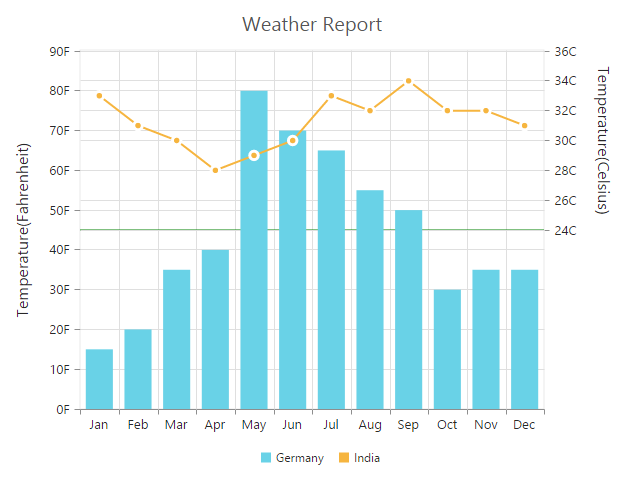
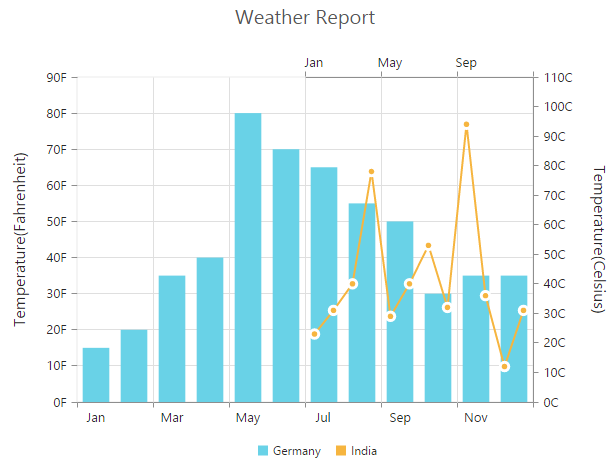
Column Definitions
To split the chart area horizontally into a number of columns, use columnDefinitions of the chart.
-
You can allocate space for each column by using the
unitoption that determines whether the chart area should be split by percentage or pixels for the givencolumnWidthvalue of the columnDefinitions. -
To associate a horizontal axis to a column, specify the columnDefinitions index value to the
columnIndexproperty of the chart axis.
//  Splitting chart area into multiple columns
this.columnDefinitions = [{
    //  Split first column of the chart area
    unit: 'percentage',
    columnWidth: 50,
}, {
    //  Split second column of the chart area
    unit: 'percentage',
    columnWidth: 50,
}];

this.axes = [{
    //Create secondary axis and bind it to second column of chart area
    name: "xAxis1",
    columnIndex: 1
}];<ej-chart id="chartcontainer" [columnDefinitions]="columnDefinitions" [axes]="axes">
<e-seriescollection>
<!--Binding horizontal axis name-->
<e-series xAxisName="xAxis1">
</e-series>
</e-seriescollection>
</ej-chart>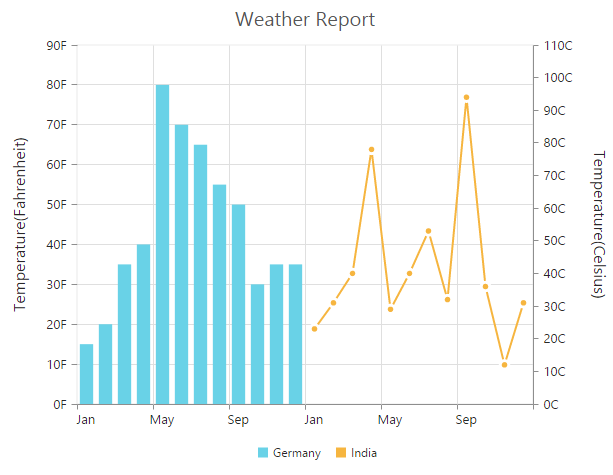
Column Span
For spanning the horizontal axis along multiple panes horizontally, you can use columnSpan property of axis.
<ej-chart id="chartcontainer" [columnDefinitions]="columnDefinitions" [axes]="axes" [primaryXAxis.columnSpan]=2>
       <e-seriescollection>
          <!--Binding horizontal axis name-->
          <e-series xAxisName="xAxis1">
          </e-series>
      </e-seriescollection>
</ej-chart>