How can I help you?
3D Chart in Angular Chart
Essential 3D Chart for Angular allows you to view 8 chart types in 3D view such as Bar, StackingBar, StackingBar100, Column, Stacked Column, 100% Stacked Column], Pie, Doughnut.
3D Column Chart
For rendering a 3D Column Chart, specify the series type as “column” in the chart series and set enable3D option as true in the chart.
<ej-chart id="chartcontainer" [enable3D]="true">
    <!--Set chart type to series-->
	<e-seriescollection>
        <e-series type="column" ></e-series>
    </e-seriescollection>

</ej-chart>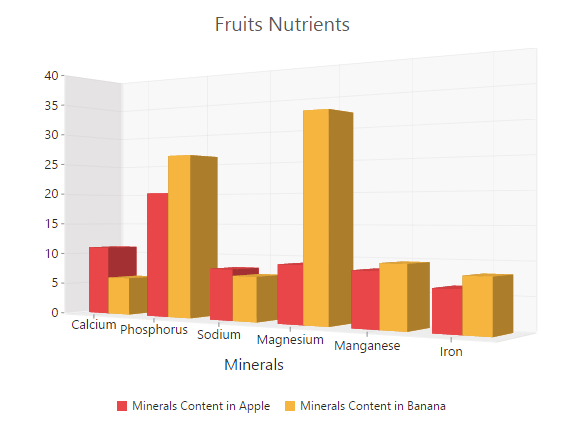
Click here to view the 3D Column Chart online demo sample.
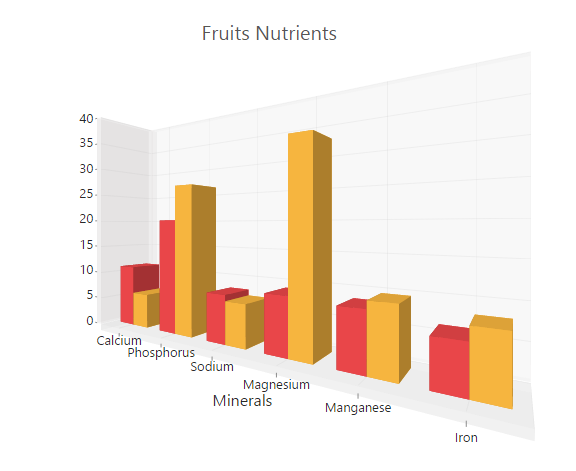
3D Bar Chart
You can create a 3D Bar Chart by setting the series type as “bar” in the chart series and enable enable3D option in the chart.
<ej-chart id="chartcontainer" [enable3D]="true">
    <!--Change chart type to series-->
	<e-seriescollection>
        <e-series type="bar" ></e-series>
    </e-seriescollection>

</ej-chart>
Click here to view the 3D Bar Chart online demo sample.
3D Stacked Column Chart
Stacking Column 3DChart is rendered by specifying the series type as “stackingColumn” in the chart series and enable enable3D option in the chart.
<ej-chart id="chartcontainer" [enable3D]="true">
	<e-seriescollection>
	    <!--Set chart type to series1-->
        <e-series type="stackingColumn" ></e-series>
		<!--Set chart type to series2-->
        <e-series type="stackingColumn" ></e-series>
    </e-seriescollection>

</ej-chart>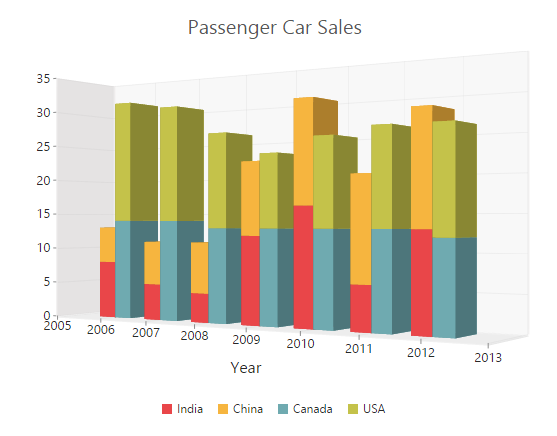
Click here to view the 3D Stacked Column Chart online demo sample.
3D 100% Stacked Column Chart
100% Stacking Column 3DChart is rendered by specifying the series type as “stackingColumn100” in the chart series and enable enable3D option in the chart.
<ej-chart id="chartcontainer" [enable3D]="true">
	<e-seriescollection>
	    <!--Set chart type to series1-->
        <e-series type="stackingColumn100" ></e-series>
		<!--Set chart type to series2-->
        <e-series type="stackingColumn100" ></e-series>
    </e-seriescollection>
</ej-chart>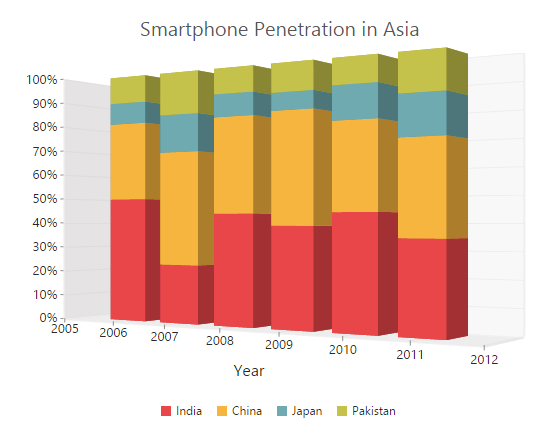
Click here to view the 3D 100% Stacked Column Chart online demo sample.
3D Stacked Bar Chart
To create Stacking Bar 3DChart, set the series type as “stackingBar” in the chart series and enable enable3D option in the chart.
<ej-chart id="chartcontainer" [enable3D]="true">
	<e-seriescollection>
	    <!--Set chart type to series1-->
        <e-series type="stackingBar" ></e-series>
		<!--Set chart type to series2-->
        <e-series type="stackingBar" ></e-series>
    </e-seriescollection>
</ej-chart>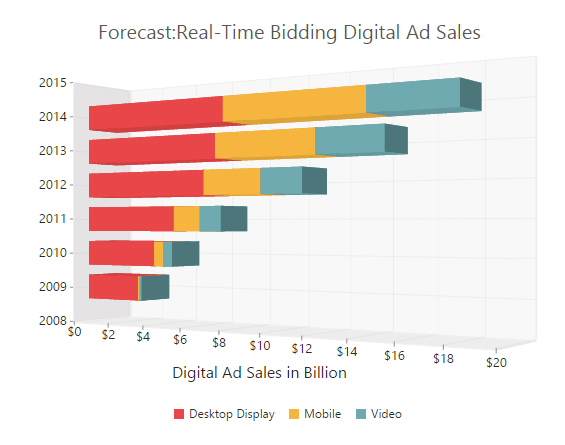
3D 100% Stacked Bar Chart
You can create 100% Stacking Bar 3DChart by setting the series type as “stackingbar100” in the chart series and enable enable3D option in chart.
<ej-chart id="chartcontainer" [enable3D]="true">
	<e-seriescollection>
	    <!--Set chart type to series1-->
        <e-series type="stackingBar" ></e-series>
		<!--Set chart type to series2-->
        <e-series type="stackingBar" ></e-series>
    </e-seriescollection>
</ej-chart>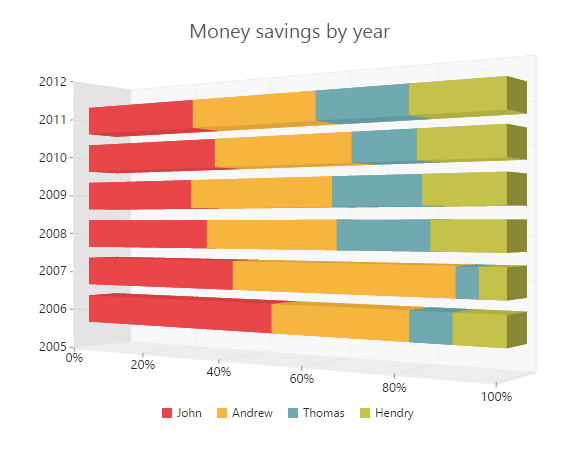
3D Pie Chart
To render the Pie Chart in 3D view, enable the enbel3D option in the chart and set the series type as “pie” in the chart series.
<ej-chart id="chartcontainer" [enable3D]="true">
	<e-seriescollection>
	    <!--Set chart type to series1-->
        <e-series type="pie" ></e-series>
    </e-seriescollection>
</ej-chart>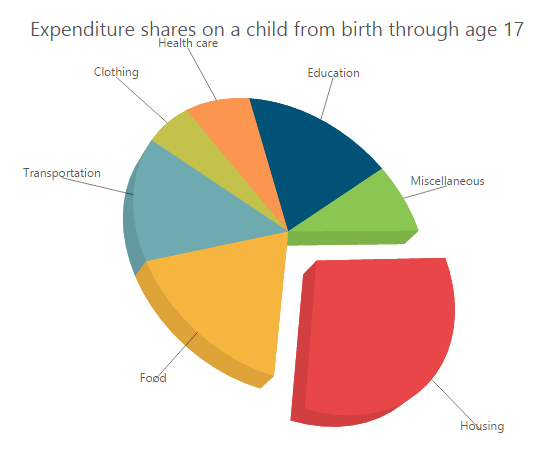
Click here to view the 3D Pie Chart online demo sample.
3D Doughnut Chart
To render the Doughnut Chart in 3D view, enable the enbel3D option in the chart and set the series type as “doughnut” in the chart series.
<ej-chart id="chartcontainer" [enable3D]="true">
	<e-seriescollection>
	    <!--Set chart type to series1-->
        <e-series type="doughnut" ></e-series>
    </e-seriescollection>
</ej-chart>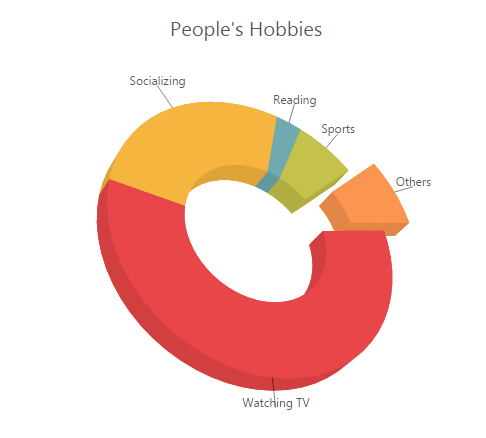
Click here to view the 3D Doughnut Chart online demo sample.
Configure 3D Chart
3D View
To render the EjChart in 3D view, set the enable3D option as true in the chart.
<ej-chart id="chartcontainer" [enable3D]="true">
</ej-chart>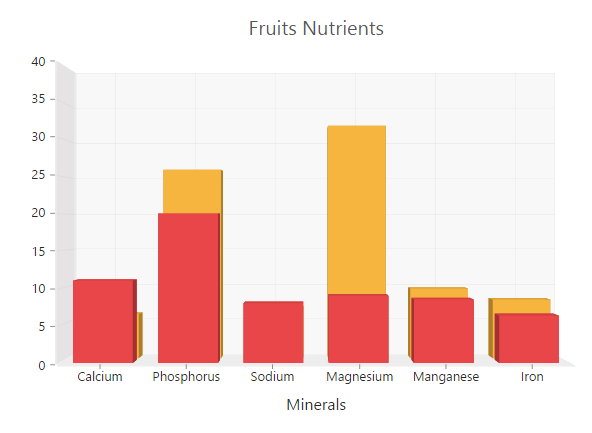
Placing Bar / Column kind of series side-by-side
The sideBySideSeriesPlacement defines the appearance of the different sets of data on the 3D Chart. When this property is enabled, the data is displayed side by side, otherwise it is displayed along the depth of the axis.
<ej-chart id="chartcontainer" [enable3D]="true" [sideBySideSeriesPlacement]="true">

</ej-chart>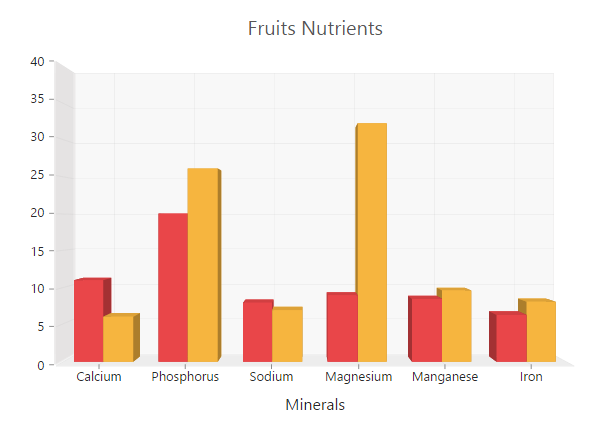
Setting Axis Wall Size
In 3DChart, Cartesian axes lines are represented as walls and it defines the width of the 3D wall. 3D Pie and Doughnut Chart does not support wallSize because they don’t have axes.
<ej-chart id="chartcontainer" [enable3D]="true" [wallSize]="10">

</ej-chart>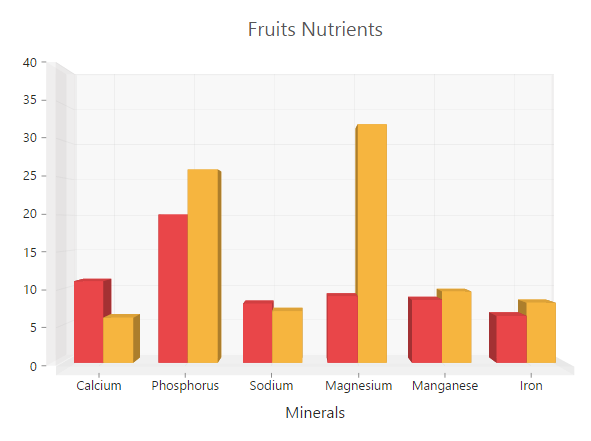
3D Depth
By using the depth property, you can view the 3D Chart from the front view of the series to the background wall.
<ej-chart id="chartcontainer" [enable3D]="true" [depth]="120">

</ej-chart>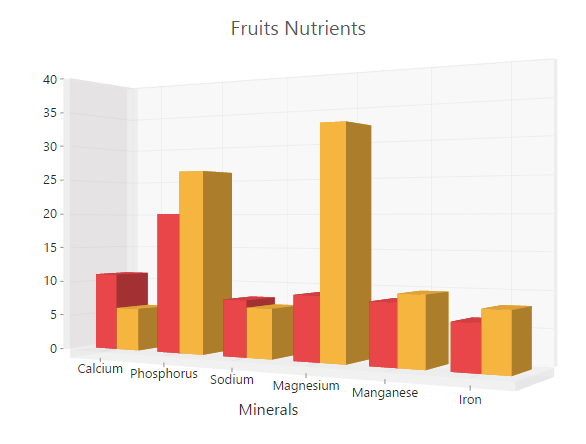
Rotating and Tilting 3D Chart
To spin the 3D Chart on mouse dragging, enable enableRotation option in the chart. The tilt property specifies the angle of the slope of the 3D Chart. The positive and negative values are declared to the side where the slope is present. The rotation option is used to rotate the 3D chart towards left or right side of the chart. The direction of the chart depends upon the positive and negative values of the angle.
<ej-chart id="chartcontainer" [enable3D]="true" [tilt]="10" [enableRotation]="true" [rotation]="40">

</ej-chart>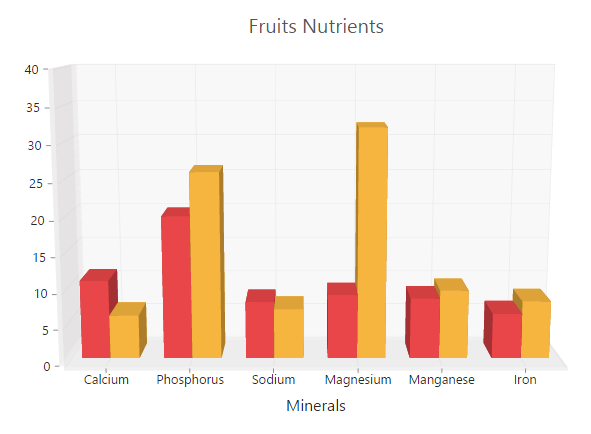
PerspectiveAngle
The perspectiveAngle specifies the appearance of the height, width, depth and wall of the 3D Chart. When the perspectiveAngle is decreased, the 3D object appears very close to the viewer. But when it is increased, the 3D object appears far away from the viewer.
<ej-chart id="chartcontainer" [enable3D]="true" [perspectiveAngle]="150">

</ej-chart>