Types of Axis in WinUI Chart (SfPolarChart)
13 Jul 20267 minutes to read
Polar chart supports the following types of chart axis.
Category Axis
The CategoryAxis is an index-based axis that plots values based on the index of the data point collection. The points are equally spaced here.
<chart:SfPolarChart>
    <chart:SfPolarChart.PrimaryAxis>
        <chart:CategoryAxis/>
    </chart:SfPolarChart.PrimaryAxis>

    <chart:SfPolarChart.SecondaryAxis>
        <chart:NumericalAxis/>
    </chart:SfPolarChart.SecondaryAxis>

    <!-- Configure additional chart elements -->
</chart:SfPolarChart>
SfPolarChart chart = new SfPolarChart();
chart.PrimaryAxis = new CategoryAxis();
chart.SecondaryAxis = new NumericalAxis();
// Configure additional chart elements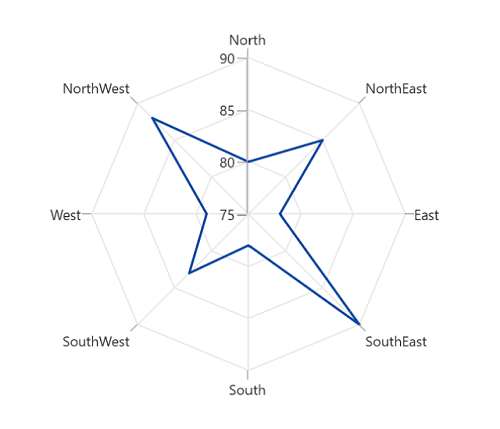
Numerical Axis
The NumericalAxis is used to plot the numerical values to the chart. NumericalAxis can be defined for both PrimaryAxis and SecondaryAxis.
<chart:SfPolarChart>
    <chart:SfPolarChart.PrimaryAxis>
        <chart:NumericalAxis/>
    </chart:SfPolarChart.PrimaryAxis>

    <chart:SfPolarChart.SecondaryAxis>
        <chart:NumericalAxis/>
    </chart:SfPolarChart.SecondaryAxis>

    <!-- Configure additional chart elements -->
</chart:SfPolarChart>
SfPolarChart chart = new SfPolarChart();
// Configure additional chart elements
chart.PrimaryAxis = new NumericalAxis();
chart.SecondaryAxis = new NumericalAxis();
// Configure additional chart elements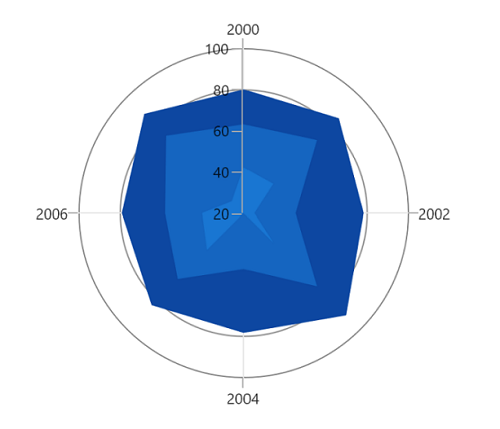
Customizing the range
Maximum and Minimum properties of the axis are used for setting the maximum and minimum values of the axis range, respectively. The Interval property is used to define the intervals for the axis.
NOTE
If the minimum or maximum value is set, the other value is calculated by default internally.
<chart:SfPolarChart>
    <chart:SfPolarChart.SecondaryAxis>
        <chart:NumericalAxis
            Minimum="10"
            Maximum="90"
            Interval="20"/>
    </chart:SfPolarChart.SecondaryAxis>

    <!-- Configure additional chart elements -->
</chart:SfPolarChart>
SfPolarChart chart = new SfPolarChart();
// Configure additional chart elements
chart.SecondaryAxis = new NumericalAxis()
{
Maximum = 90,
Minimum = 10,
Interval = 20,
};
// Configure additional chart elements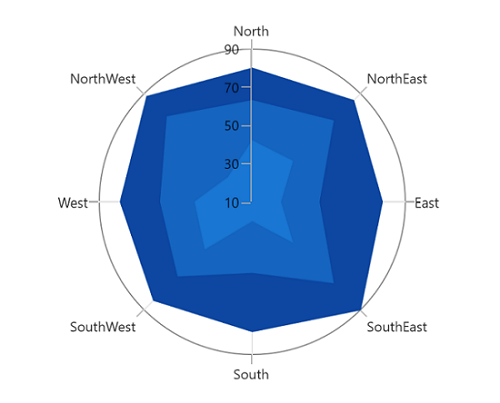
DateTime Axis
The DateTimeAxis is used to plot the chart with DateTime values. The Interval and IntervalType properties can be used to customize the intervals.
<chart:SfPolarChart>
    <chart:SfPolarChart.PrimaryAxis>
        <chart:DateTimeAxis Interval="1" IntervalType="Months">
            <chart:DateTimeAxis.LabelStyle>
                <chart:LabelStyle LabelFormat="MMM/dd"/>
            </chart:DateTimeAxis.LabelStyle>
        </chart:DateTimeAxis>
    </chart:SfPolarChart.PrimaryAxis>

    <chart:SfPolarChart.SecondaryAxis>
        <chart:NumericalAxis/>
    </chart:SfPolarChart.SecondaryAxis>

    <!-- Configure additional chart elements -->
</chart:SfPolarChart>
SfPolarChart chart = new SfPolarChart();
chart.PrimaryAxis = new DateTimeAxis()
{
Interval = 1,
IntervalType = DateTimeIntervalType.Months,
LabelStyle = new LabelStyle() { LabelFormat="MMM/dd" },
};
chart.SecondaryAxis = new NumericalAxis();
// Configure additional chart elements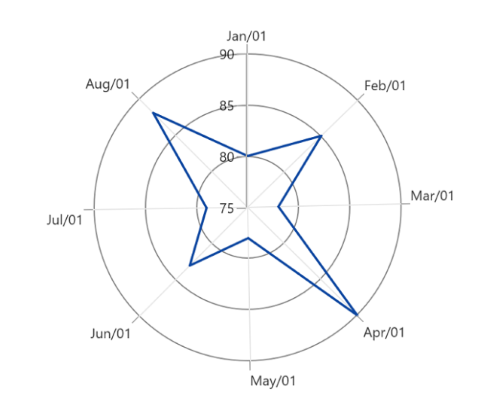
Logarithmic Axis
The LogarithmicAxis uses a logarithmic scale, making it highly effective for visualizing data with large range differences. It can be applied to both the PrimaryAxis and SecondaryAxis.
<chart:SfPolarChart>

    <!-- Configure additional chart elements -->
    <chart:SfPolarChart.SecondaryAxis>
        <chart:LogarithmicAxis/>
    </chart:SfPolarChart.SecondaryAxis>
</chart:SfPolarChart>
SfPolarChart chart = new SfPolarChart();
// Configure additional chart elements
LogarithmicAxis secondaryAxis = new LogarithmicAxis()
chart.SecondaryAxis.Add(secondaryAxis);
Interval
The Axis interval can be customized using the Interval property of the axis. By default, the interval is calculated based on the minimum and maximum values of the provided data, with a default value of 1.
<chart:SfPolarChart>

    <!-- Configure additional chart elements -->
    <chart:SfPolarChart.SecondaryAxis>
        <chart:LogarithmicAxis Interval="10"/>
    </chart:SfPolarChart.SecondaryAxis>
</chart:SfPolarChart>
SfPolarChart chart = new SfPolarChart();
// Configure additional chart elements
LogarithmicAxis secondaryAxis = new LogarithmicAxis()
{
Interval = 10,
};
chart.SecondaryAxis.Add(secondaryAxis);Customizing the Range
The range of the logarithmic axis can be customized using the Minimum and Maximum properties of the LogarithmicAxis. By default, the range is automatically calculated to align with the provided data.
<chart:SfPolarChart>

    <!-- Configure additional chart elements -->
    <chart:SfPolarChart.SecondaryAxis>
        <chart:LogarithmicAxis Minimum="100" Maximum="10000"/>
    </chart:SfPolarChart.SecondaryAxis>
</chart:SfPolarChart>
SfPolarChart chart = new SfPolarChart();
// Configure additional chart elements
LogarithmicAxis secondaryAxis = new LogarithmicAxis()
{
Minimum = 100,
Maximum = 10000,
};
chart.SecondaryAxis.Add(secondaryAxis);Customizing the Logarithmic base
The logarithmic axis base can be customized using the LogarithmicBase property. The default base value is 10.
<chart:SfPolarChart>

    <!-- Configure additional chart elements -->
    <chart:SfPolarChart.SecondaryAxis>
        <chart:LogarithmicAxis LogarithmicBase="2"/>
    </chart:SfPolarChart.SecondaryAxis>
</chart:SfPolarChart>
SfPolarChart chart = new SfPolarChart();
// Configure additional chart elements
LogarithmicAxis secondaryAxis = new LogarithmicAxis()
{
LogarithmicBase = 2,
};
chart.SecondaryAxis.Add(secondaryAxis);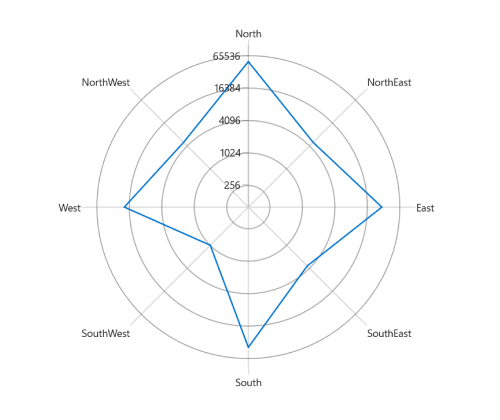
Events
ActualRangeChanged
The ActualRangeChanged event is triggered when the actual range of the axis is changed. The argument contains the following information:
- ActualMinimum - used to get the actual minimum value of the axis.
- ActualMaximum - used to get the actual maximum value of the axis.
LabelCreated
The LabelCreated event is triggered when the axis label is created. The argument contains the following information:
- Label - Used to get or set the text of the axis label.
- Position - Used to get the position of the label.
- LabelStyle - Used to customize the appearance of axis labels.