Getting Started with WinUI Polar Chart (SfPolarChart)
10 Jul 202615 minutes to read
This section explains how to populate the WinUI Polar Chart with data, header, data labels, legend, and tooltips, as well as the essential aspects for getting started with the chart.
Creating an application with WinUI Chart
- Create a WinUI 3 desktop app for C# and .NET 5.
- Add a reference to Syncfusion.Chart.WinUI NuGet.
- Import the control namespace
Syncfusion.UI.Xaml.Chartsin XAML or C# to initialize the control. -
Initialize SfPolarChart control.
<Window
    x:Class="ChartDemo.MainWindow"

    <!-- Configure additional chart elements -->
    xmlns:chart="using:Syncfusion.UI.Xaml.Charts">
    <chart:SfPolarChart/>
</Window>
using Syncfusion.UI.Xaml.Charts; // Configure additional chart elements public sealed partial class MainWindow : Window { public MainWindow() { this.InitializeComponent(); SfPolarChart chart = new SfPolarChart(); this.Content = chart; } }
Initialize View Model
Now, let us define a simple data model that represents a data point in chart.
public class PlantData
{
    public string Direction { get; set; }
    public double Tree { get; set; }
}
Next, create a view model class and initialize a list of PlantData objects as follows.
public class ChartViewModel
{
    public ObservableCollection<PlantData> PlantDetails { get; set; }

    public ChartViewModel()
    {
        PlantDetails = new ObservableCollection<PlantData>()
        {
            new PlantData(){ Direction = "North", Tree = 80 },
            new PlantData(){ Direction = "NorthEast", Tree = 87 },
            new PlantData(){ Direction = "East", Tree = 78 },
            new PlantData(){ Direction = "SouthEast", Tree = 85 },
            new PlantData(){ Direction = "South", Tree = 81 },
            new PlantData(){ Direction = "SouthWest", Tree = 88 },
            new PlantData(){ Direction = "West", Tree = 80 },
            new PlantData(){ Direction = "NorthWest", Tree = 85 },
        };
    }
}
Create a ChartViewModel instance and set it as the chart’s DataContext. This enables property binding from the ChartViewModel class.
NOTE
If you prefer to set
DataContextin XAML, add the namespace of theViewModelclass to your XAML Page.
<Window

    <!-- Configure additional chart elements -->
    xmlns:chart="using:Syncfusion.UI.Xaml.Charts"
    xmlns:model="using:ChartDemo.ViewModel">

    <chart:SfPolarChart>
        <chart:SfPolarChart.DataContext>
            <model:ChartViewModel/>
        </chart:SfPolarChart.DataContext>
    </chart:SfPolarChart>
</Window>
ChartViewModel viewModel = new ChartViewModel();
chart.DataContext = viewModel;
// Configure additional chart elementsInitialize Chart Axis
ChartAxis is used to locate the data points inside the chart area. The PrimaryAxis and SecondaryAxis properties of the chart are used to initialize the axes for the chart.
<chart:SfPolarChart>
      <chart:SfPolarChart.PrimaryAxis>
           <chart:CategoryAxis/>
      </chart:SfPolarChart.PrimaryAxis>

      <chart:SfPolarChart.SecondaryAxis>
           <chart:NumericalAxis/>
      </chart:SfPolarChart.SecondaryAxis>

      <!-- Configure additional chart elements -->
</chart:SfPolarChart>
SfPolarChart chart = new SfPolarChart();
CategoryAxis primaryAxis = new CategoryAxis();
chart.PrimaryAxis = primaryAxis;
NumericalAxis secondaryAxis = new NumericalAxis();
chart.SecondaryAxis = secondaryAxis;
// Configure additional chart elementsPopulate Chart with Data
Adding PolarAreaSeries to the polar chart Series collection and binding Data to the series ItemsSource property from its DataContext for creating the polar chart.
NOTE
To plot the series, the XBindingPath and YBindingPath properties must be configured so that the chart may get values from the respective properties in the data model.
<chart:SfPolarChart>
    <chart:SfPolarChart.PrimaryAxis>
        <chart:CategoryAxis/>
    </chart:SfPolarChart.PrimaryAxis>

    <chart:SfPolarChart.SecondaryAxis>
        <chart:NumericalAxis/>
    </chart:SfPolarChart.SecondaryAxis>

    <chart:SfPolarChart.Series>
        <chart:PolarAreaSeries
            ItemsSource="{Binding PlantDetails}"
            XBindingPath="Direction"
            YBindingPath="Tree"/>
    </chart:SfPolarChart.Series>

    <!-- Configure additional chart elements -->
</chart:SfPolarChart>
SfPolarChart chart = new SfPolarChart();
ChartViewModel viewModel = new ChartViewModel();
chart.DataContext = viewModel;
CategoryAxis primaryAxis = new CategoryAxis();
chart.PrimaryAxis = primaryAxis;
NumericalAxis secondaryAxis = new NumericalAxis();
chart.SecondaryAxis = secondaryAxis;
PolarAreaSeries series = new PolarAreaSeries();
series.XBindingPath = "Direction";
series.YBindingPath = "Tree";
series.SetBinding(ChartSeries.ItemsSourceProperty, new Binding()
{
Path = new PropertyPath("PlantDetails")
});
chart.Series.Add(series);
// Configure additional chart elementsAdd Title
The title of the chart provides quick information to the user about the data being plotted in the chart. The Header property is used to set the title for the polar chart as follows.
<chart:SfPolarChart Header="Polar Chart">

<!-- Configure additional chart elements -->
</chart:SfPolarChart>
SfPolarChart chart = new SfPolarChart();
chart.Header = "Polar Chart";
// Configure additional chart elementsEnable Data Labels
The ShowDataLabels property of series can be used to enable the data labels to improve the readability of the chart. The label visibility is set to False by default.
<chart:SfPolarChart>

    <!-- Configure additional chart elements -->
    <chart:PolarAreaSeries
        ShowDataLabels="True"
        ItemsSource="{Binding PlantDetails}"
        XBindingPath="Direction"
        YBindingPath="Tree">
    </chart:PolarAreaSeries>
</chart:SfPolarChart>
SfPolarChart chart = new SfPolarChart();
PolarAreaSeries series = new PolarAreaSeries();
series.ShowDataLabels = true;
// Configure additional chart elementsEnable Legend
The legend provides information about the data point displayed in the polar chart. The Legend property of the chart is used to enable it.
<chart:SfPolarChart>

    <!-- Configure additional chart elements -->
    <chart:SfPolarChart.Legend>
        <chart:ChartLegend/>
    </chart:SfPolarChart.Legend>

</chart:SfPolarChart>
SfPolarChart chart = new SfPolarChart();
// Configure additional chart elements
chart.Legend = new ChartLegend();
// Configure additional chart elementsNOTE
Additionally, set a label for each series using the Label property of the chart series, which will be displayed in the corresponding legend.
<chart:SfPolarChart>

    <!-- Configure additional chart elements -->
    <chart:PolarAreaSeries
        ItemsSource="{Binding PlantDetails}"
        XBindingPath="Direction"
        YBindingPath="Tree"
        Label="Tree"/>

</chart:SfPolarChart>
SfPolarChart chart = new SfPolarChart();
// Configure additional chart elements
PolarAreaSeries series = new PolarAreaSeries();
series.ItemsSource = viewModel.PlantDetails;
series.XBindingPath = "Direction";
series.YBindingPath = "Tree";
series.Label = "Tree";
// Configure additional chart elementsThe following code example gives you the complete code of above configurations.
<chart:SfPolarChart Header="Polar Chart">
    <chart:SfPolarChart.DataContext>
        <model:ChartViewModel/>
    </chart:SfPolarChart.DataContext>

    <chart:SfPolarChart.PrimaryAxis>
        <chart:CategoryAxis/>
    </chart:SfPolarChart.PrimaryAxis>

    <chart:SfPolarChart.SecondaryAxis>
        <chart:NumericalAxis/>
    </chart:SfPolarChart.SecondaryAxis>

    <chart:SfPolarChart.Legend>
        <chart:ChartLegend/>
    </chart:SfPolarChart.Legend>

    <chart:SfPolarChart.Series>
        <chart:PolarAreaSeries
            ItemsSource="{Binding PlantDetails}"
            XBindingPath="Direction"
            YBindingPath="Tree"
            Label="Tree"
            ShowDataLabels="True"
            LegendIcon="Pentagon">
            <chart:PolarAreaSeries.DataLabelSettings>
                <chart:PolarDataLabelSettings
                    Foreground="White"
                    FontSize="12"
                    FontFamily="Calibri"
                    BorderBrush="White"
                    BorderThickness="1"
                    Margin="1"/>
            </chart:PolarAreaSeries.DataLabelSettings>
        </chart:PolarAreaSeries>
    </chart:SfPolarChart.Series>
</chart:SfPolarChart>
using Syncfusion.UI.Xaml.Charts;
// Configure additional chart elements
public sealed partial class MainWindow : Window
{
public MainWindow()
{
SfPolarChart chart = new SfPolarChart();
chart.Header = "Polar Chart";
chart.Legend = new ChartLegend();
ChartViewModel viewModel = new ChartViewModel();
chart.DataContext = viewModel;
CategoryAxis primaryAxis = new CategoryAxis();
chart.PrimaryAxis = primaryAxis;
NumericalAxis secondaryAxis = new NumericalAxis();
chart.SecondaryAxis = secondaryAxis;
PolarAreaSeries series = new PolarAreaSeries();
series.XBindingPath = "Direction";
series.YBindingPath = "Tree";
series.Label = "Tree";
series.LegendIcon = ChartLegendIcon.Pentagon;
series.ShowDataLabels = true;
series.DataLabelSettings = new PolarDataLabelSettings()
{
Foreground = new SolidColorBrush(Colors.White),
BorderBrush = new SolidColorBrush(Colors.White),
BorderThickness = new Thickness(1),
Margin = new Thickness(1),
FontFamily = new FontFamily("Calibri"),
FontSize = 12
};
series.SetBinding(ChartSeries.ItemsSourceProperty, new Binding()
{
Path = new PropertyPath("PlantDetails")
});
chart.Series.Add(series);
this.Content = chart;
}
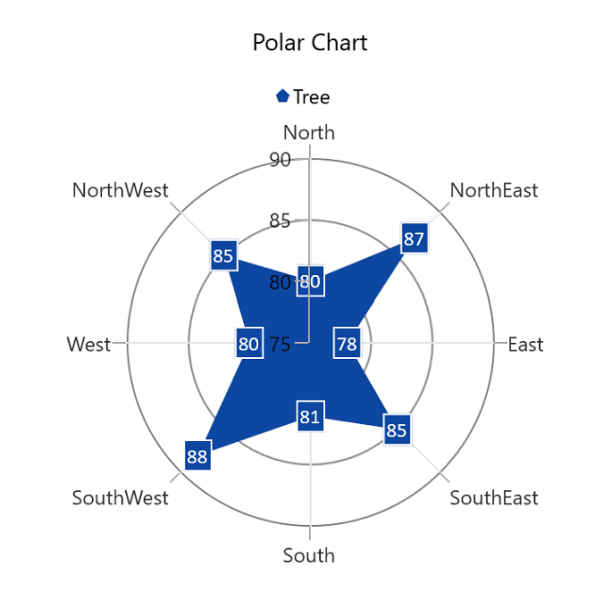
}The following chart is created as a result of the previous codes.
NOTE
Download the demo application from GitHub.
NOTE
You can also explore our WinUI Polar Chart example that shows how to easily configure it with built-in support for creating stunning visual effects.