About Syncfusion® .NET MAUI Radial Gauge Control
18 Nov 20185 minutes to read
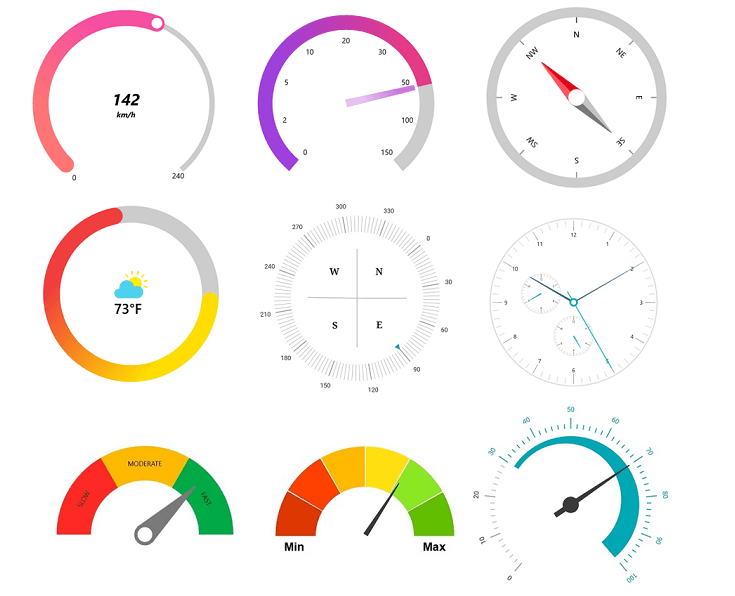
The Syncfusion® .NET MAUI Radial Gauge is a multi-purpose data visualization control, that displays numerical values on a circular scale. It has a rich set of features such as axes, ranges, pointers, and annotations that are fully customizable and extendable. Use it to create speedometers, temperature monitors, dashboards, meter gauges, multi axis clocks, watches, progress indicators, compasses, and more.
Business use cases
- Dashboard applications that display key performance indicators using circular gauge visualization.
- Industrial and monitoring systems that require real-time tracking of values such as temperature, speed, or pressure.
- Automotive and IoT applications that use gauge visuals such as speedometers and meters.
- Business analytics apps that require intuitive representation of values and thresholds using radial layouts.
Key features
- Axis allows displaying values along a circular scale with customizable labels, ticks, and axis lines.
- Range allows highlighting specific value intervals to represent thresholds and critical ranges.
- Pointer allows indicating values using needle, shape, content, and range pointers with full customization.
- Pointer animation allows smoothly animating value changes for better visual experience.
- Pointer interaction allows users to drag pointers to update values dynamically at runtime.
- Annotation allows adding text, images, or custom UI elements at specific positions on the gauge.
Globalization
The following table summarizes the globalization support available in this control.
 Full Support
 Partial Support
 No Support
| Control | Localization | RTL | Time zone | Screen reader | Keyboard navigation |
|---|---|---|---|---|---|
| Radial Gauge | |
|
|
|
|
Related controls
- Linear Gauge for displaying values along a linear scale.
- Circular Charts for visualizing proportional data using circular charts.
- Digital Gauge for displaying numeric or character values using segmented digital display styles.
See Also
- Getting Started shows a step‑by‑step guide to begin using the Radial Gauge control.
- Pointers explains how to configure different pointer types and behavior.
- Annotation helps add labels, shapes, or custom content inside the gauge for context.
- UI Kit provides interactive demos and ready‑made UI examples.
Resources
Feature Tour
Get a quick overview of key features and capabilities to kick start your journey.
Explore Features
Tutorial Videos
Watch step‑by‑step video guides to quickly understand concepts and implementation.
Watch now
Knowledge Base
Find practical solutions, troubleshooting tips and how‑to guides for common scenarios.
Search KB's
Use Case Sample
Explore a real-world application that demonstrates the practical use of the RadialGauge.
View Sample