How can I help you?
Getting Started with Essential JavaScript Maps
This section explains briefly about how to create Maps in your application with JavaScript.
Create your first Map in JavaScript
You can configure an Essential JavaScript Map in simple steps. In this example, you can learn how to configure USA population map with customized appearance and tooltip.
Add Libraries
To use ejMap, refer the following libraries in HTML page.
- jQuery version 1.10.1 and above,
- ej.widgets.all.min
- JsRender
You can link these libraries from a Content Delivery Network (CDN).
<!--  jquery script  -->
    <script src="http://code.jquery.com/jquery-1.10.1.min.js" type="text/javascript"></script>

    <!-- Essential JS UI widget -->
    <script src="http://cdn.syncfusion.com/33.1.44/js/
    ej.widgets.all.min.js"></script>

    <!-- JS Render widget -->
    <script src="http://cdn.jsdelivr.net/jsrender/1.0pre35/jsrender.min.js" type="text/javascript"></script>
Prepare Shape Data
The Shape Data collection describing geographical shape information can be obtained from GEOJSON format shapes.
In this example, USA shape is used as shape data by utilizing the “United States of America.json” file in the following folder structure obtained from downloaded Maps_GeoJSON folder.
..\ Maps_GeoJSON\All Countries with States
You can assign the complete contents in “United States of America.json” file to new JSON object. For your better understanding, a JS file “usa.js” is already created to store JSON data in JSON object “usMap”.
[usa.js]
var usMap = //Paste all the content copied from the JSON file//Prepare DataSource
The datasource is populated with JSON data relative to shape data and stored in JSON object. USA population as datasource is used for better understanding. The “populationData.js” file is used to store JSON data in JSON object “populationData”.
[populationData.js]
var populationData = [
        { name: "California", population: "38332521" },
        { name: "Texas", population: "26448193" },
        { name: "New York", population: "19651127" },
        { name: "Florida", population: "19552860" },
        { name: "Illinois", population: "12882135" },
        { name: "Pennsylvania", population: "12773801" },
        { name: "Ohio", population: "11570808" },
        { name: "Georgia", population: "9992167" },
        { name: "Michigan", population: "9895622" },
        { name: "North Carolina", population: "9848060" },
        { name: "New Jersey", population: "8899339" },
        { name: "Virginia", population: "8260405" },
        { name: "Washington", population: "6971406" },
        { name: "Massachusetts", population: "6692824" },
        { name: "Arizona", population: "6626624" },
        { name: "Indiana", population: "6570902" },
        { name: "Tennessee", population: "6495978" },
        { name: "Missouri", population: "6044171" },
        { name: "Maryland", population: "5928814" },
        { name: "Wisconsin", population: "5742713" },
        { name: "Minnesota", population: "5420380" },
        { name: "Colorado", population: "5268367" },
        { name: "Alabama", population: "4833722" },
        { name: "South Carolina", population: "4774839" },
        { name: "Louisiana", population: "4625470" },
        { name: "Kentucky", population: "4395295" },
        { name: "Oregon", population: "3930065" },
        { name: "Oklahoma", population: "3850568" },
        { name: "Puerto Rico", population: "3615086" },
        { name: "Connecticut", population: "3596080" },
        { name: "Iowa", population: "3090416" },
        { name: "Mississippi", population: "2991207" },
        { name: "Arkansas", population: "2959373" },
        { name: "Utah", population: "2900872" },
        { name: "Kansas", population: "2893957" },
        { name: "Nevada", population: "2790136" },
        { name: "New Mexico", population: "2085287" },
        { name: "Nebraska", population: "1868516" },
        { name: "West Virginia", population: "1854304" },
        { name: "Idaho", population: "1612136" },
        { name: "Hawaii", population: "1404054" },
        { name: "Maine", population: "1328302" },
        { name: "New Hampshire", population: "1323459" },
        { name: "Rhode Island", population: "1051511" },
        { name: "Montana", population: "1015165" },
        { name: "Delaware", population: "925749" },
        { name: "South Dakota", population: "844877" },
        { name: "Alaska", population: "735132" },
        { name: "North Dakota", population: "723393" },
        { name: "District of Columbia", population: "646449" },
        { name: "Vermont", population: "626630" },
        { name: "Wyoming", population: "582658" }
]
Refer to both shape data and datasource as illustrated in the following code example.
<!-- Shape data file-->
    <script src="usa.js" type="text/javascript"></script>

    <!-- Data source file-->
    <script src="populationData.js" type="text/javascript"></script>
Initialize Map
1. Create a <div> tag with a specific id and set the height and width to determine the rendering map’s size.
<body>
        <div id="mapContainer" style="width: 900px; height: 600px;"></div>
    </body>
2. Add a script tag anywhere in the web page and add the following code.
<script type="text/javascript" language="javascript ">
        jQuery(function ($) {
            $("#mapContainer").ejMap({
                layers: [
                {
                    shapeData: usMap
                }]
            });
        });
    </script>
3. The final HTML file appears as follows.
<html xmlns="http://www.w3.org/1999/xhtml">
    <head>
        <title></title>

        <!--  jquery script  -->
        <script src="http://code.jquery.com/jquery-1.10.1.min.js" type="text/javascript"></script>

        <!-- Essential JS UI widget -->
        <script src="http://cdn.syncfusion.com/33.1.44/js/ej.widgets.all.min.js"></script>

        <!-- JS Render widget -->
        <script src="http://cdn.jsdelivr.net/jsrender/1.0pre35/jsrender.min.js" type="text/javascript"></script>

        <!-- Shape data source file-->
        <script src="usa.js" type="text/javascript"></script>

        <!-- Business data source file-->
        <script src="populationData.js" type="text/javascript"></script>
    </head>
    <body>

        <div  id="mapContainer" style="width: 900px; height: 600px;"></div>

        <script type="text/javascript">
            jQuery(function ($) {
                $("#mapContainer").ejMap({
                    layers: [
                    {
                        shapeData: usMap
                    }]
                });
	       });
        </script>

    </body>
    </html>
The above code renders a map, with default properties and shape input provided through data in layers.
Data Binding in Map
The following properties in shape layers are used for binding data in Map control.
- dataSource
- shapeDataPath
- shapePropertyPath
DataSource
The dataSource property accepts collection values as input. For example, the list of objects can be provided as input.
Shape Data Path
The shapeDataPath property used to refer the data ID in dataSource. For example, “populationData” JSON object contains data ids ‘name’ and ‘population’. The shapeDataPath and the shapePropertyPath properties are related to each other (refer to shapePropertyPath for more details).
Shape Property Path
The shapePropertyPath property is similar to the shapeDataPath that refers the column name in the shapeData property of shape layers to identify the shape. When the values of the shapeDataPath property in the dataSource property and the value of shapePropertyPath in the shapeData property match, then the associated object from the dataSource is bound to the corresponding shape.
The JSON object “populationData” is used as dataSource in the following code example.
<script type="text/javascript">
        jQuery(function ($) {
            $("#mapContainer").ejMap({
                layers: [
                {
                    shapeData: usMap,
                    shapeDataPath: "name",
                    shapePropertyPath: "name",
                    dataSource: populationData
                }]
            });
        });
    </script>
Map Dimensions
The width and height of the map can be customized by setting the value directly to the container of the map.
You can also specify the map dimensions in percentage.
NOTE
you can also set the width and height by using CSS style.
To set width and height directly to the container of the map
<div id="map" style="width:820px; height:400px;"></div>To set width and height in percentage
<div id="map" style="width:100%; height:100%;"></div>To set width and height in CSS Style
<style>
     div#map {
        height: 400px;
        width: 820px;
    }
  </style>
  <div id="map"></div>
The following code example illustrates setting the map in the given width and height,
<div id="map" style="width:820px;height:400px"></div>

    <script>

        jQuery(function ($) {
            $("#map").ejMap({
                layers: [
                {
                    shapeData: world_map,
                    enableMouseHover: true,
                    labelSettings: {
                        showLabels: true,
                        labelPath: 'admin',
                    },
                    shapeSettings: {
                        fill: "lightgreen",
                        stroke: "red",
                        highlightColor: "#63B7B7",
                    },
                }]
            });
        });

    </script>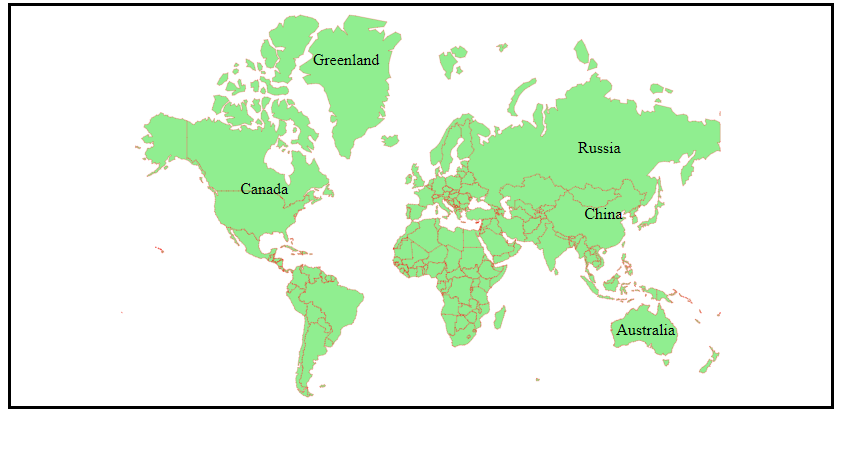
In the above screenshot, you can see some space in the map, because it is not stretched to use the entire width.
If you stretch the map as per width, projection of shapes will not be proper, and also you cannot get proper latitude and longitude.
So, the map is not stretched. You can avoid this by setting the height and width equally(i.e. space appears due to unequal width and height).
Customize Map Appearance
You can customize the shape’s color by using fill, stroke and strokeThickness properties in shapeSettings.
<script type="text/javascript">
        jQuery(function ($) {
            $("#mapContainer").ejMap({
                layers: [
                {
                    shapeData: usMap,
                    shapeDataPath: "name",
                    shapePropertyPath: "name",
                    dataSource: populationData,
                    enableSelection: false,
                    enableMouseHover: true,
                    shapeSettings: {
                        fill: "#9CBF4E",
                        strokeThickness: "0.5",
                        stroke: "White",
                        highlightStroke: "White",
                        highlightColor: "#BC5353",
                        highlightBorderWidth: "1"
                    }
                }]
            });
        });
    </script>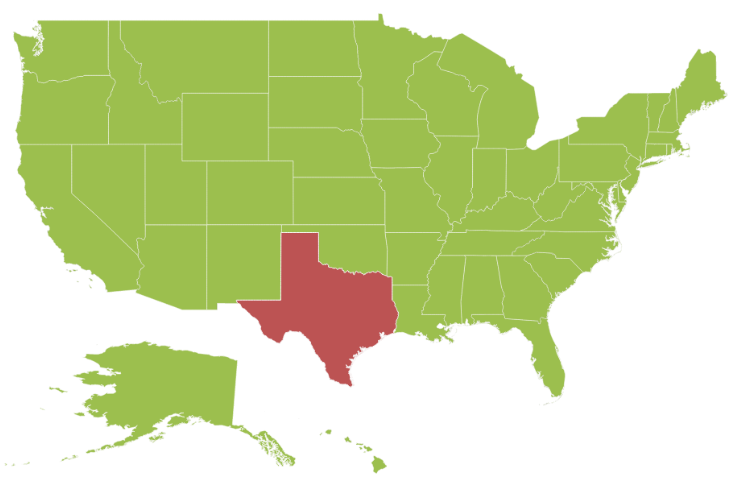
Customize Map Appearance by Range
The Range color mapping is used to differentiate the shape’s fill based on its underlying value and color ranges. The from and to properties defines the value ranges and the gradientColors property defines the equivalent color ranges respective to their value ranges.
NOTE
The
enableGradientproperty value is set to true to apply gradient colors for the maps.
<script type="text/javascript">
jQuery(function ($) {
$("#mapContainer").ejMap({
layers: [
{
shapeData: usMap,
shapeDataPath: "name",
shapePropertyPath: "name",
dataSource: populationData,
enableSelection: false,
enableMouseHover: true,
shapeSettings: {
fill: "#9CBF4E",
strokeThickness: "0.5",
stroke: "White",
highlightStroke: "White",
highlightColor: "#BC5353",
highlightBorderWidth: "1",
valuePath: "name",
colorValuePath: "population",
enableGradient: true,
colorMappings:
{
rangeColorMapping: [
{
from: 500000,
to: 1000000,
gradientColors: ["#9CBF4E", "#B8CE7B"]
},
{
from: 1000001,
to: 5000000,
gradientColors: ["#B8CE7B", "#CBD89A"]
},
{
from: 5000001,
to: 10000000,
gradientColors: ["#CBD89A", "#DEE2B9"]
},
{
from: 10000001,
to: 40000000,
gradientColors: ["#DEE2B9", "#F1ECD8"]
}
]
}
}
}]
});
});
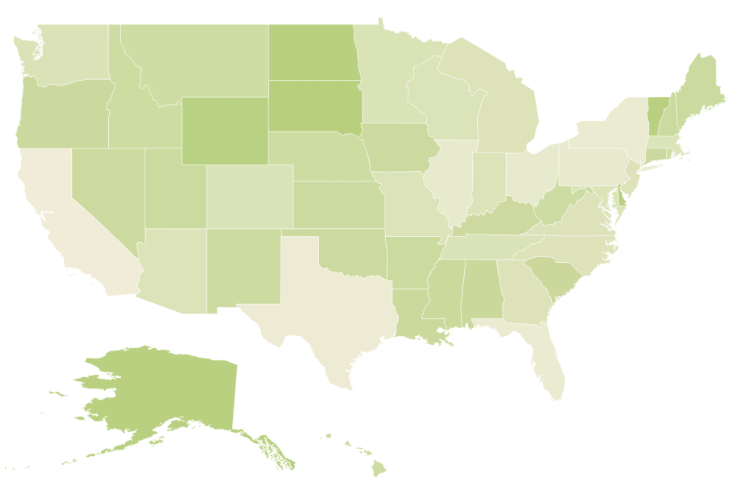
</script>The following screenshot illustrates a map with gradient color property enabled.
Enable Tooltip
The tooltip is displayed only when the showTooltip is set to “true” in the layers. By default, it takes the property of the bound object that is referred in the valuePath and displays its content on hovering the corresponding shape. The tooltipTemplate property is used for customizing the template for tooltip.
<script type="text/javascript">
jQuery(function ($) {
$("#mapContainer").ejMap({
layers: [
{
// ...
shapeSettings: {
// ...
valuePath: "name",
// ...
},
showTooltip: true
}]
});
});
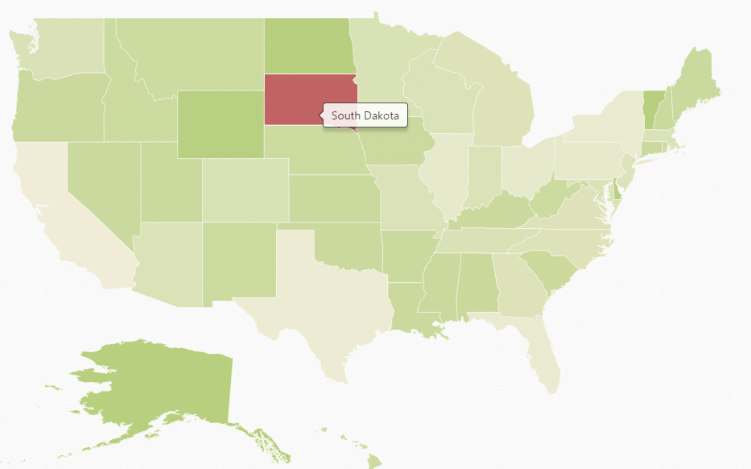
</script>The following screenshot illustrates a map control displaying a Tooltip.
Legend
A Legend can be made visible by setting the showLegend property in legendSettings. Height and width of the legend can be applied by using the properties height and width
Interactive Legend
The legends can be made interactive with an arrow mark indicating the exact range color in the legend, when the mouse hovers on the corresponding shape. You can enable this option by setting the mode property in the legendSettings value as “interactive”. The default value of mode property is “default” to enable the normal legend.
Title
Use the title property to provide title for interactive legend.
Label
You can use leftLabel and rightLabel property to provide left and right labels for interactive legend.
DockOnMap and Dock Position
dockOnMap determines whether the legend should be placed outside or inside the map bounds.
dockPosition determines the legend placement and it is valid only when dockOnMap is true.
Icon
To get icon value for legend setting. You can set [iconHeight] and [iconWidth] property for legend settings.
label Orientation
Set the orientation of legend labels by using labelOrientation property.
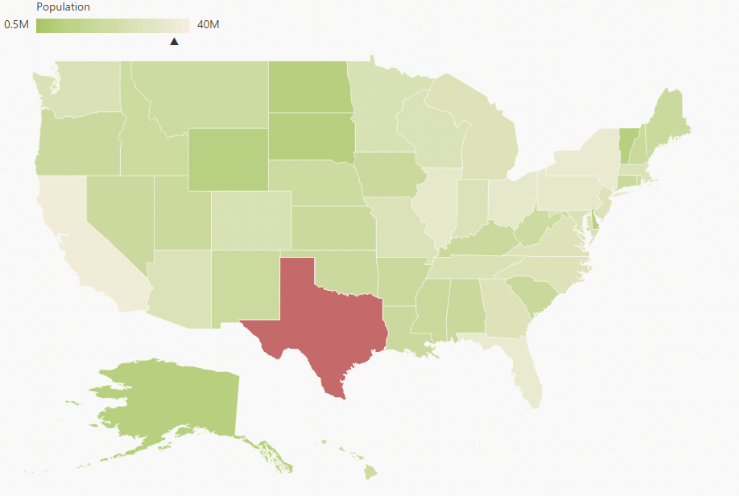
Show Labels
Enables or Disables the showLabels
<script type="text/javascript">
        jQuery(function ($) {
            $("#mapContainer").ejMap({
                layers: [
                {
                    shapeData: usMap,
                    shapeDataPath: "name",
                    shapePropertyPath: "name",
                    dataSource: populationData,
                    enableSelection: false,
                    enableMouseHover: true,
                    shapeSettings: {
                        fill: "#9CBF4E",
                        strokeThickness: "0.5",
                        stroke: "White",
                        highlightStroke: "White",
                        highlightColor: "#BC5353",
                        highlightBorderWidth: "1",
                        valuePath: "population",
                        enableGradient: true,
                        colorMappings:
                        {
                            rangeColorMapping: [
                            {
                                from: 500000,
                                to: 1000000,
                                gradientColors: ["#9CBF4E", "#B8CE7B"]
                            },
                            {
                                from: 1000001,
                                to: 5000000,
                                gradientColors: ["#B8CE7B", "#CBD89A"]
                            },
                            {
                                from: 5000001,
                                to: 10000000,
                                gradientColors: ["#CBD89A", "#DEE2B9"]
                            },
                            {
                                from: 10000001,
                                to: 40000000,
                                gradientColors: ["#DEE2B9", "#F1ECD8"]
                            }]
                        }
                    },
                    legendSettings: {
                        showLegend:true,
						dockOnMap:true,
                        height:18,
                        width:190,
                        mode:"interactive",
                        title: "Population",
                        leftLabel: "0.5M",
                        rightLabel: "40M"
                    }
                }]
            });
        });
    </script>
The following screenshot illustrates a map displaying an interactive legend.

The complete code sample can be found here.