Customization
10 Aug 201824 minutes to read
Maps control supports color customization to determine the exact combination of colors for shapes displayed in Maps and tooltip support to display additional information of shape data.
Shape Settings
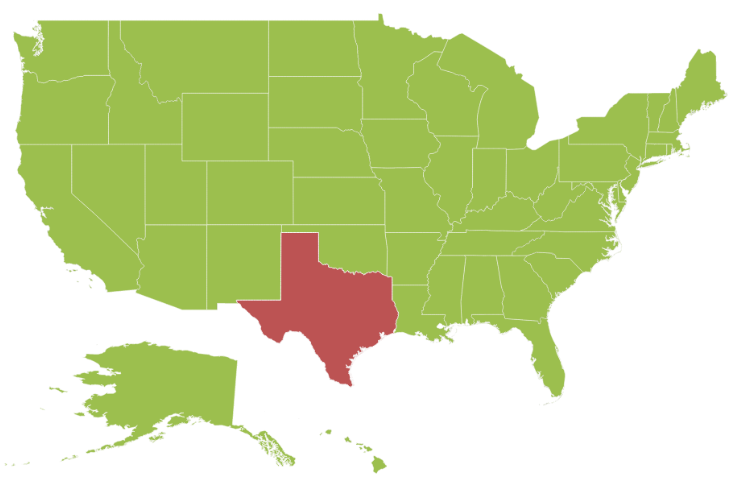
The shapeSettings defines the basic customization settings of shapes in the map.
The important property that makes an impact on shape colors is the autoFill. This autoFill property is available in the shapeSettings.
-
fill- It is used to set the fill color of the shapes in the map. -
stroke- It is used to set the border color of the shape in the map. -
strokeThickness- It is used to set the border thickness of the shape in the map. -
highlightStroke- It Specifies the mouse over stroke color of the shape layer in map. -
highlightColor- It is used to set the mouse hover color for shapes in the map. -
highlightBorderWidth- It is used to set the mouse hover border width for shapes in the map. -
selectionColor- It is used to set the selection color for shapes in the map.
The above properties of shapeSettings are applied only when the autoFill property value is set to false. By default, the autoFill property value is false.
jQuery(function ($) {
        $("#mapContainer").ejMap({
            layers: [
            {
                shapeData: usMap,
                enableMouseHover:true,
                shapeSettings: {
                    fill: "#9CBF4E",
                    strokeThickness: "0.5",
                    stroke: "White",
                    highlightStroke: "White",
                    highlightColor: "#BC5353",
                    highlightBorderWidth: "1"
                }
            }]
        });
     });
Color Mapping
The Color Mapping support enables the customization of shape colors based on the underlying value of shape received from bounded data.
-
colorValuePath- It renders the field value that is to be fetched from data for each shape used for determining the shape color. -
valuePath- It renders the field value that is to be fetched from data for each shape. This support also provides a tree map-like impact on the map UI. The various types ofColor Mappingsupported in maps are listed as follows. -
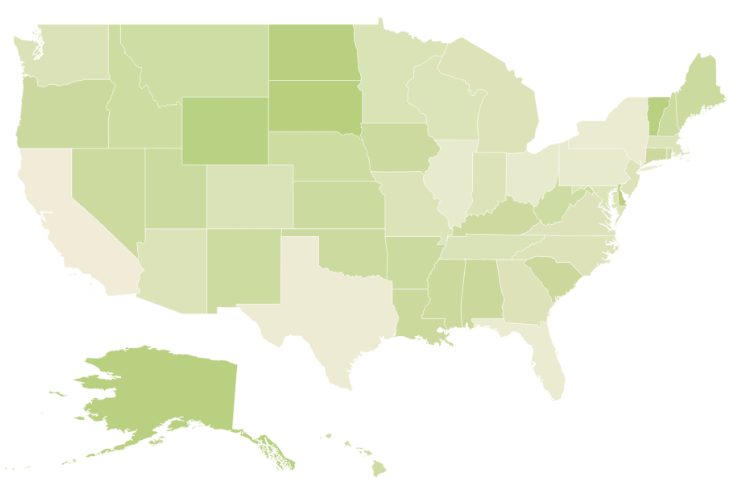
rangeColorMapping- It is used to differentiate the shape’s fill based on its underlying value and color ranges. The properties of rangeColorMapping are listed in the following table.
| Property | Type | Description |
|---|---|---|
| [`from`](../api/ejmap#members:layers-shapesettings-colormappings-rangecolormapping-from) | Double | Gets or sets start value |
| [`to`](../api/ejmap#members:layers-shapesettings-colormappings-rangecolormapping-to) | Double | Gets or sets end value |
| color | Color | Gets or sets the colors to be applied for specific range value containing shapes when [`enableGradient`](../api/ejmap#members:layers-shapesettings-enablegradient) property value is false. |
| label | String | Gets or sets the label for legend when mode property value is ‘default’. |
| [`gradientColors`](../api/ejmap#members:layers-shapesettings-colormappings-rangecolormapping-gradientcolors) | Array | Gets or sets the start point and end point gradient colors to be applied for specific range value containing shapes when [`enableGradient`](../api/ejmap#members:layers-shapesettings-enablegradient) property value is set to true. |
jQuery(function ($) {
$("#mapContainer").ejMap({
layers: [
{
shapeData: usMap,
shapeDataPath: "name",
shapePropertyPath: "name",
dataSource:populationData,
shapeSettings: {
fill: "#9CBF4E",
strokeThickness: "0.5",
stroke: "White",
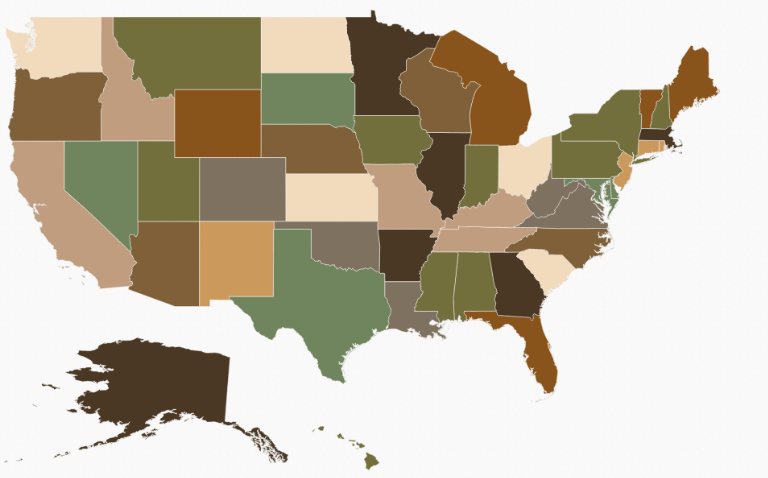
valuePath: 'population',
enableGradient: true,
colorMappings:
{
rangeColorMapping: [
{
from: 500000,
to: 1000000,
gradientColors: ["#9CBF4E", "#B8CE7B"]
},
{
from: 1000001,
to: 5000000,
gradientColors: ["#B8CE7B", "#CBD89A"]
},
{
from: 5000001,
to: 10000000,
gradientColors: ["#CBD89A", "#DEE2B9"]
},
{
from: 10000001,
to: 40000000,
gradientColors: ["#DEE2B9", "#F1ECD8"]
}]
}
}
}]
});
});When the underlying object value is 700000, then the fill color of the corresponding shape is set between #9CBF4E and #B8CE7B.
When the underlying value is below any of the given sorted range or above the sorted range, then the fill is set from fill.
-
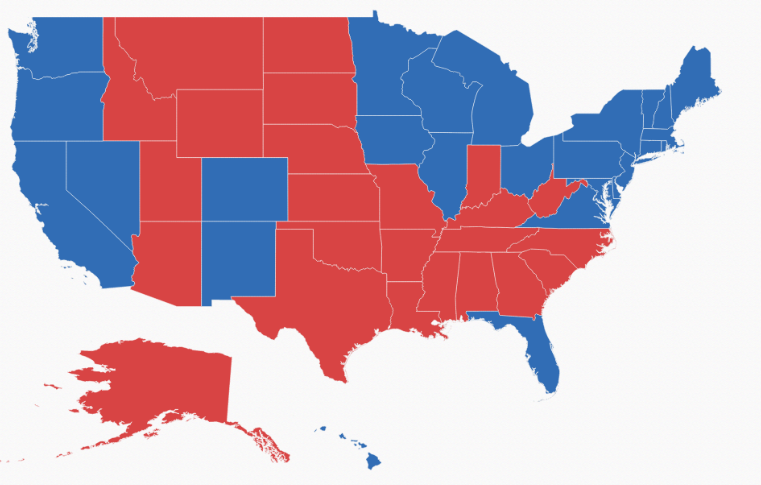
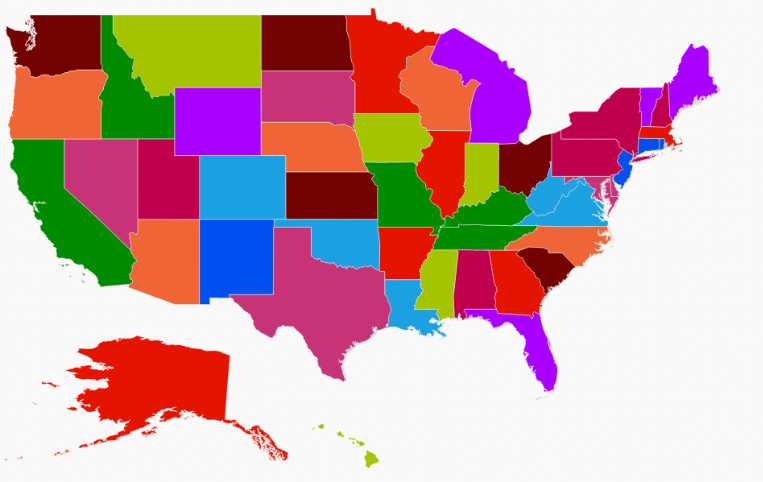
equalColorMapping- The equalColorMapping is used to differentiate the shape’s fill based on its underlying value and color. The properties of equalColorMapping is listed in the following table.
| Property | Type | Description |
|---|---|---|
| [`value`](../api/ejmap#members:layers-shapesettings-colormappings-equalcolormapping-value) | String | Gets or sets the value. |
| [`color`](../api/ejmap#members:layers-shapesettings-colormappings-equalcolormapping-color) | String | Gets or sets the color for mapping. |
In equal color mapping, value property contains the values of the field set in colorValuePath property of shape settings.
Here USA election data is considered as input datasource and stored in “electionData.js”.
var electionData = [
            { State: "Alabama", Candidate: "Romney", Electors: 9 },
            { State: "Alaska", Candidate: "Romney", Electors: 3 },
            { State: "Arizona", Candidate: "Romney", Electors: 11 },
            { State: "Arkansas", Candidate: "Romney", Electors: 6 },
            { State: "California", Candidate: "Trump", Electors: 55 },
            { State: "Colorado", Candidate: "Trump", Electors: 9 },
            { State: "Connecticut", Candidate: "Trump", Electors: 7 },
            { State: "Delaware", Candidate: "Trump", Electors: 3 },
            { State: "District of Columbia", Candidate: "Trump", Electors: 3 },
            { State: "Florida", Candidate: "Trump", Electors: 29 },
            { State: "Georgia", Candidate: "Romney", Electors: 16 },
            { State: "Hawaii", Candidate: "Trump", Electors: 4 },
            { State: "Idaho", Candidate: "Romney", Electors: 4 },
            { State: "Illinois", Candidate: "Trump", Electors: 20 },
            { State: "Indiana", Candidate: "Romney", Electors: 11 },
            { State: "Iowa", Candidate: "Trump", Electors: 6 },
            { State: "Kansas", Candidate: "Romney", Electors: 6 },
            { State: "Kentucky", Candidate: "Romney", Electors: 8 },
            { State: "Louisiana", Candidate: "Romney", Electors: 8 },
            { State: "Maine", Candidate: "Trump", Electors: 4 },
            { State: "Maryland", Candidate: "Trump", Electors: 10 },
            { State: "Massachusetts", Candidate: "Trump", Electors: 11 },
            { State: "Michigan", Candidate: "Trump", Electors: 16 },
            { State: "Minnesota", Candidate: "Trump", Electors: 10 },
            { State: "Mississippi", Candidate: "Romney", Electors: 6 },
            { State: "Missouri", Candidate: "Romney", Electors: 10 },
            { State: "Montana", Candidate: "Romney", Electors: 3 },
            { State: "Nebraska", Candidate: "Romney", Electors: 5 },
            { State: "Nevada", Candidate: "Trump", Electors: 6 },
            { State: "New Hampshire", Candidate: "Trump", Electors: 4 },
            { State: "New Jersey", Candidate: "Trump", Electors: 14 },
            { State: "New Mexico", Candidate: "Trump", Electors: 5 },
            { State: "New York", Candidate: "Trump", Electors: 29 },
            { State: "North Carolina", Candidate: "Romney", Electors: 15 },
            { State: "North Dakota", Candidate: "Romney", Electors: 3 },
            { State: "Ohio", Candidate: "Trump", Electors: 18 },
            { State: "Oklahoma", Candidate: "Romney", Electors: 7 },
            { State: "Oregon", Candidate: "Trump", Electors: 7 },
            { State: "Pennsylvania", Candidate: "Trump", Electors: 20 },
            { State: "Rhode Island", Candidate: "Trump", Electors: 4 },
            { State: "South Carolina", Candidate: "Romney", Electors: 9 },
            { State: "South Dakota", Candidate: "Romney", Electors: 3 },
            { State: "Tennessee", Candidate: "Romney", Electors: 11 },
            { State: "Texas", Candidate: "Romney", Electors: 38 },
            { State: "Utah", Candidate: "Romney", Electors: 6 },
            { State: "Vermont", Candidate: "Trump", Electors: 3 },
            { State: "Virginia", Candidate: "Trump", Electors: 13 },
            { State: "Washington", Candidate: "Trump", Electors: 12 },
            { State: "West Virginia", Candidate: "Romney", Electors: 5 },
            { State: "Wisconsin", Candidate: "Trump", Electors: 10 },
            { State: "Wyoming", Candidate: "Romney", Electors: 3 }
]jQuery(function($) {
$("#mapContainer").ejMap({
layers: [
{
shapeData: usMap,
shapeDataPath: "State",
shapePropertyPath: "name",
dataSource: electionData,
shapeSettings:
{
strokeThickness: 0.5,
autoFill: false,
stroke: "white",
valuePath: "Electors",
colorValuePath: "Candidate",
colorMappings:
{
equalColorMapping:
[
{ value: "Romney", color: "#D84444" },
{ value: "Trump", color: "#316DB5" }
]
}
}
}]
});
});
Binding color from the datasource
By using colorPath property, you can bind the specific field in the datasource to the map, and the shapes will be rendered based the color values available from the field you bind.
NOTE
While setting color for map by using [
colorPath] property, do not set any other color mapping hence color mapping is having higher priority than [colorPath].
jQuery(function($) {

    $("#maps").ejMap({
     //…
     layers: [
     {
            shapeSettings: {
               colorPath: "shapeFill",
            }
     //…
    });
});
While binding color path for map, it is possible to render legend for each shape in the map. To achieve this, set the textPath for legend. textPath contains another field name in the datasource. As per the text, content in the field legend will be generated.
$("#maps").ejMap({
     //…
     layers: [
     {
            shapeSettings: {
               colorPath: "shapeFill",
            },
            legendSettings: {
               showLegend: true,
               textPath: “name”
            }
     //…
});
Color Palette
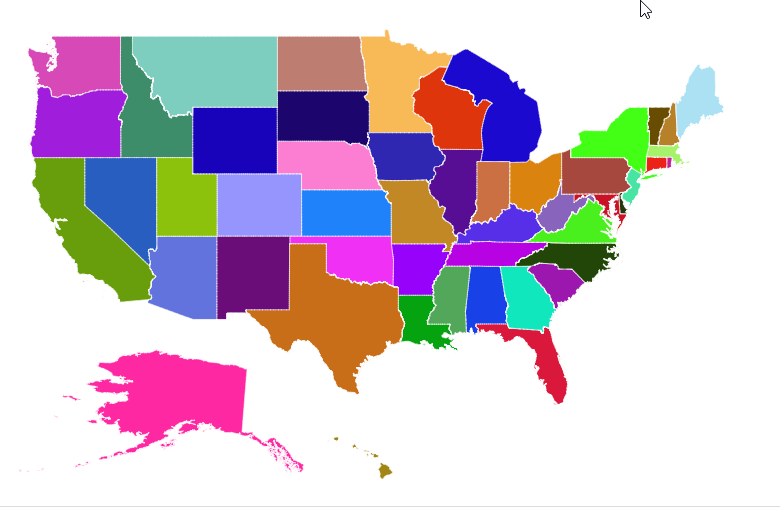
AutoFill
When autoFill property is set to true, shapes are filled with default colors from built-in palettes or custom palette.
jQuery(function($) {
        $("#mapContainer").ejMap({
            layers: [
            {
                shapeData: usMap,
                shapeSettings: {
                    strokeThickness: 0.5,
                    stroke: "white",
                    autoFill: true
                }
            }]
        });
    });
Color Palette
The colorPalette property determines whether the auto fill colors are fetched from built-in color palettes or custom palette.
The colorPalette property can be set with palette1, palette2, palette3 and custompalette values where palette1, palette2 and palette3 are built-in color palettes and default value for this property is “palette1”.
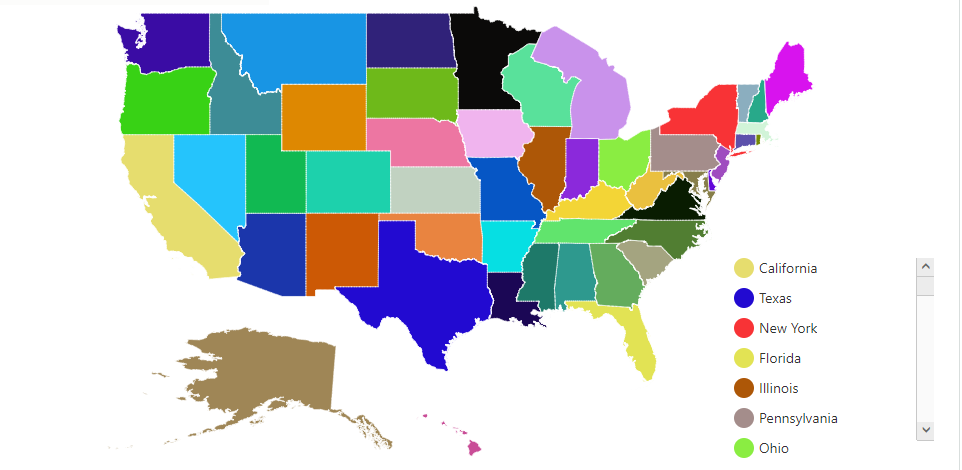
The customPalette property is used to set an array of colors to be auto filled in shapes.
This property is enabled only when colorPalette property value is set to “custompalette”.
jQuery(function ($) {
        $("#mapContainer").ejMap({
            layers: [
            {
                // ...
                ShapeSettings: {
                    // ...
                    autoFill: true,
                    colorPalette: "custompalette",
                    customPalette: ["#E51400", "#A4C400", "#730202","#008B00", "#EF6535",
                                    "#1BA0E2", "#C63477", "#0050EF", "#BF004D", "#AA00FF"]
                    // ...
                }
            }]
        });
    });
Tooltip
The tooltip is displayed only when you set showTooltip to “true” in the shape layers. By default, it takes the property of the bound object that is referred in the valuePath and displays its content on hovering the corresponding shape.
jQuery(function ($) {
        $("#mapContainer").ejMap({
            layers: [
            {
                // ...
                ShapeSettings: {
                    // ...
                    valuePath: "name",
                    fill: '#9CBF4E',
                    strokeThickness: "0.5",
                    stroke: "White",
                    highlightStroke: "White",
                    highlightColor: "#BC5353",
                    highlightBorderWidth: "1"
                    // ...
                }
                showTooltip: true,
                shapeDataPath: "name",
                shapePropertyPath: "name",
                dataSource: USA_State_PopulationData,
                enableMouseHover: true
            }]
        });
    });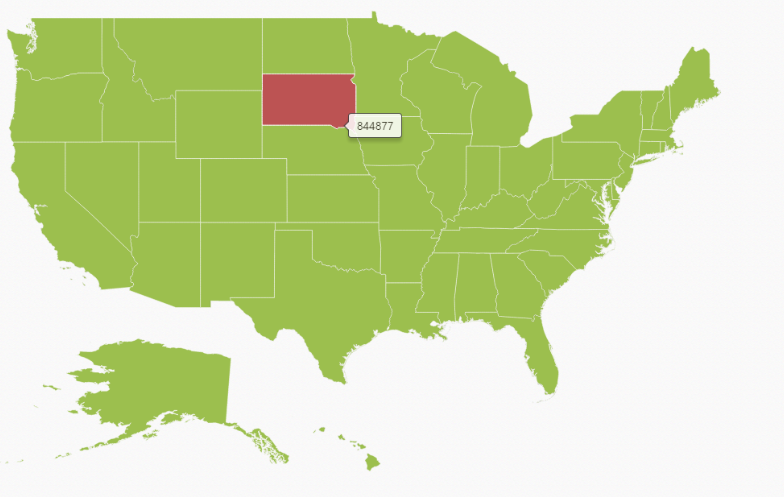
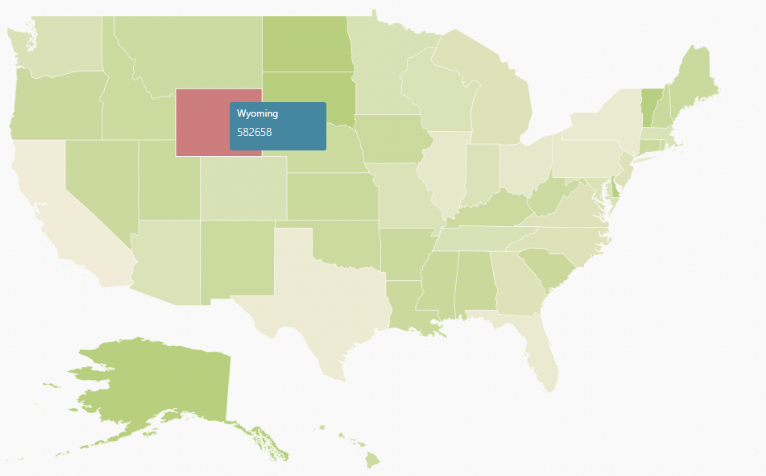
Tooltip Template
The tooltipTemplate property is used for customizing the template for tooltip.
<script type="text/javascript">
        jQuery(function ($) {
            $("#mapContainer").ejMap({
                layers: [
                    {
                        // ...
                        ShapeSettings: {
                            // ...
                            valuePath: "name",
                            fill: '#9CBF4E',
                            strokeThickness: "0.5",
                            stroke: "White",
                            highlightStroke: "White",
                            highlightColor: "#BC5353",
                            highlightBorderWidth: "1"
                            // ...
                        }
                        showTooltip: true,
                        toolTipTemplate: 'myTooltip',
                        shapeDataPath: "name",
                        shapePropertyPath: "name",
                        dataSource: USA_State_PopulationData,
                        enableMouseHover: true
                    }]
            });
        });
    </script>

    <div  id="myTooltip" style="display: none;">
        <div >
            <div style="height:60px;width:120px;background:#4586a0;border-radius:3px;">
                <div style="margin-top:-20px;margin-left:9px;padding-top:3px">
                    <label style="margin-top:-20px;font-weight:normal;font-size:12px;color:white;font-family:Segoe UI;">{{:name}}</label>
                </div>
                <div style="height:10px;"></div>
                <div style="margin-top:-10px;margin-left:9px;">
                    <label style="margin-top:-10px;font-weight:normal;font-size:14px;color:white;font-family:segoe ui light;">{{:population}}</label>
                </div>
            </div>
        </div>
    </div>
The following screenshot illustrates a map control displaying a Tooltip with template.
Customize map background
The Map background can be customized by using the background property of the Map.
$("#container").ejMap({

            // ...

            //Customizing Map background
            background: "skyblue",

            // ...

        });
Base Map Index
Specifies the index of the map to determine the shape layer to be displayed, you can use baseMapIndex property and the default value is 0.
//To set baseMapIndex API value during initialization

  $("#container").ejMap({
      baseMapIndex:0
   });
show Map Items
Shows or hides the map items.
$("#container").ejMap({layers: [{ showMapItems:false }]})Center Position
Specify the centerPosition where map should be displayed
// Set the centerPosition during initialization.
   $("#container").ejMap({centerPosition: [38.5000, -98]});
Label Settings
The labelSettings defines the basic customization settings of labels in the map.
The below properties are used for labelSettings
-
enableSmartLabel- enable or disable the enableSmartLabel property. -
labelLength- set the labelLength property. -
labelPath- set the labelPath property. -
showLabels- The property specifies whether to show labels or not -
smartLabelSize- set the smartLabelSize property.
jQuery(function ($) {
        $("#mapContainer").ejMap({
            layers: [
            {
                shapeData: usMap,
                enableMouseHover:true,
                LabelSettings: {
                    enableSmartLabels: false,
                    labelLength: "2",
                    labelPath: "",
                    showLabels: false,
                    showLabelSize: "fixed",
                }
            }]
        });
     });
The appearance of the labels can be customized using the font, color, fontFamily, fontStyle, fontWeight, opacity, and size properties.
The following code example shows how to customize the font.
jQuery(function ($) {
        $("#mapContainer").ejMap({
            layers: [
            {
                shapeData: usMap,
                enableMouseHover:true,
                LabelSettings: {
                    showLabels: true,
                    font: { color: "black", size:"13px" }
                }
            }]
        });
     });