- Adding range collection
- Range Customization
- Colors and Border
- Positioning the ranges
- Multiple Ranges
Contact Support
Ranges
10 Jan 201824 minutes to read
Ranges are used to specify or group the scale values. You can describe the values in the pointers using ranges.
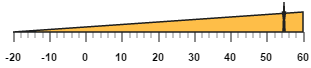
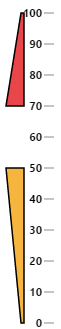
Adding range collection
Range collection can be directly added to the scale object. Refer the following code example to add range collection in a Linear Gauge control.
<div id="LinearGauge1"></div>$(function () {
//For Linear gauge rendering
$("#LinearGauge1").ejLinearGauge({
enableAnimation: false,
width: 600,
height: 150,
orientation: "Horizontal",
labelColor: "Black",
enableResize: true,
//Adding scale collection
scales: [{
width: 0,
backgroundColor: "#AEC75F",
direction: ej.datavisualization.LinearGauge.Directions.Clockwise,
border: { width: 0, color: "transparent" }, minimum: -20, maximum: 60,
showBarPointers: false, showRanges: true,
//Adding marker pointers collection
markerPointers: [{
width: 3, length: 30, backgroundColor: "#FE5C09", type: "star",
distanceFromScale: 20, placement: "near",
value: 55
}],
//Adding label collection
labels: [{ angle: 90, distanceFromScale: { x: 0, y: 50 } }],
//Adding tick collection
ticks: [{
type: "majorinterval", width: 2,
color: "#8c8c8c", distanceFromScale: { x: 25, y: -1 }
},
{
type: "minorinterval", width: 1, height: 6,
color: "#8c8c8c", distanceFromScale: { x: 25, y: -1 }
}],
//Adding range collection
ranges: [{
startValue: -20, endValue: 60,
startWidth: 0, endWidth: 20, backgroundColor: "#FEBE48",
placement: "near", distanceFromScale: 20
}]
}]
});
});Execute the above code to render the following output.
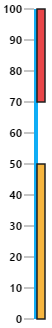
Range Customization
Appearance
The major attributes for ranges are startValue and endValue. The startValue defines the start position of the range and endValue defines the end position of the range. The startWidth and endWidth are used to specify the range width at the starting and ending position of the ranges.
<div id="LinearGauge1"></div>$(function () {
// For Linear Gauge rendering
$("#LinearGauge1").ejLinearGauge({
labelColor: "#8c8c8c", width: 500, load: "loadGaugeTheme",
//Adding scale collection
scales: [{
position: { x: 50, y: 50 },
width: 4, backgroundColor: "#10ADF5", border: {
color:
"transparent", width: 0
}, showRanges: true, showScaleBar: true,
showMarkerPointers: false, length: 310,
//Adding label collection
labels: [{
font: {
size: "11px", fontFamily: "Segoe UI", fontStyle:
"bold"
}, distanceFromScale: { x: -12 }
}],
//Adding ticks collection
ticks: [{ type: "majorinterval", width: 1, color: "#8c8c8c" }],
//Adding ranges collection
ranges: [
{
endValue: 50, // For setting range end value
startValue: 0, //For setting range start value
startWidth: 8,
endWidth: 8,
backgroundColor: "#F6B53F",
distanceFromScale: 5
},
{
endValue: 100,
startValue: 70,
startWidth: 8,
endWidth: 8,
distanceFromScale: 5,
backgroundColor: "#E94649" //For setting range background color
}]
}]
});
});Execute the above code to render the following output.
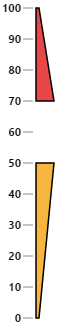
Colors and Border
-
You can customize the ranges to improve the appearance of the Gauge. The range
borderis modified with the object called border. It has two border property such ascolorandwidthwhich are used to customize the border color of the ranges and border width of the ranges. -
You can set the background color to improve the look and feel of the Linear Gauge. For customizing the background color of the ranges,
backgroundColoris used.You can add the gradient effects to the ranges by usinggradientobject. -
The opacity of the ranges can be adjusted with the property
opacity. The opacity values lies between 0 and 1.
<div id="LinearGauge1"></div>$(function () {
// For Linear gauge rendering
$("#LinearGauge1").ejLinearGauge({
labelColor: "#8c8c8c", width: 500, load: "loadGaugeTheme",
//Adding scale collection
scales: [{
position: { x: 50, y: 50 },
//Adding label collection
labels: [{
font: {
size: "11px", fontFamily: "Segoe UI", fontStyle:
"bold"
}, distanceFromScale: { x: -12 }
}],
//Adding ticks collection
ticks: [{ type: "majorinterval", width: 1, color: "#8c8c8c" }],
width: 4, backgroundColor: "transparent", border: {
color:
"transparent", width: 0
}, showRanges: true, showScaleBar: true,
showMarkerPointers: false, length: 310,
//Adding ranges collection
ranges: [{
endValue: 50, // For setting range end value
startValue: 0, // For setting range start value
backgroundColor: "#F6B53F",
border: { color: "black" },
startWidth: 3,
endWidth: 18,
distanceFromScale: 10
}
, {
endValue: 100,
startValue: 70,
backgroundColor: "#E94649",
border: { color: "black" },
startWidth: 18,
endWidth: 3,
distanceFromScale: 10
}]
}]
});
});Execute the above code to render the following output.
Positioning the ranges
-
You can position ranges using two properties such as distanceFromScale and placement. The
distanceFromScaleproperty defines the distance between the scale and range. -
placementproperty is used to locate the pointer with respect to scale either inside the scale or outside the scale or along the scale. It is an enumerable data type.
<div id="LinearGauge1"></div>$(function () {
// For Linear Gauge rendering
$("#LinearGauge1").ejLinearGauge({
labelColor: "#8c8c8c", width: 500, load: "loadGaugeTheme",
//Adding scale position
scales: [{
position: { x: 50, y: 50 },
//Adding label collection
labels: [{
font: {
size: "11px", fontFamily: "Segoe UI", fontStyle:
"bold"
}, distanceFromScale: { x: -12 }
}],
//Adding ticks collection
ticks: [{ type: "majorinterval", width: 1, color: "#8c8c8c" }],
width: 4, backgroundColor: "transparent", border: {
color:
"transparent", width: 0
}, showRanges: true, showScaleBar: true,
showMarkerPointers: false, length: 310,
//Adding ranges collection
ranges: [{
endValue: 50, // For setting range end value
startValue: 0, // For setting range start value
backgroundColor: "#F6B53F",
border: { color: "black" },
startWidth: 3,
endWidth: 18,
distanceFromScale: -30,
placement: "near"
}
, {
endValue: 100,
startValue: 70,
backgroundColor: "#E94649",
border: { color: "black" },
startWidth: 18,
endWidth: 3,
distanceFromScale: -30,
placement: "near"
}]
}]
});
});Execute the above code to render the following output.
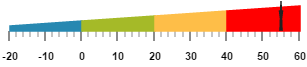
Multiple Ranges
You can set multiple ranges by adding an array of range objects. Refer the following code example for multiple range functionality.
<div id="LinearGauge1"></div>$(function () {
// For rendering Linear gauge
$("#LinearGauge1").ejLinearGauge({
enableAnimation: false,
width: 600,
height: 150,
orientation: "Horizontal",
labelColor: "Black",
enableResize: true,
//Adding scale collection
scales: [{
width: 0,
backgroundColor: "#AEC75F",
direction: ej.datavisualization.LinearGauge.Directions.Clockwise,
border: { width: 0, color: "transparent" }, minimum: -20, maximum: 60,
showBarPointers: false, showRanges: true,
//Adding marker pointer collection
markerPointers: [{
width: 3, length: 30, backgroundColor: "#FE5C09", type: "star",
distanceFromScale: 20, placement: "near",
value: 55
}],
//Adding label collection
labels: [{ angle: 90, distanceFromScale: { x: 0, y: 50 } }],
//Adding tick collection
ticks: [{
type: "majorinterval", width: 2,
color: "#8c8c8c", distanceFromScale: { x: 20, y: -1 }
},
{
type: "minorinterval", width: 1, height: 6,
color: "#8c8c8c", distanceFromScale: { x: 20, y: -1 }
}],
//Adding ranges collection
ranges: [
//Adding range 1
{
placement: "near",
distanceFromScale: 20,
startValue: -20, endValue: 0, startWidth: 5, endWidth: 10,
backgroundColor: "#2788B1", border: { color: "#2788B1" }
},
//Adding range 2
{
placement: "near",
distanceFromScale: 20,
startValue: 0, endValue: 20, startWidth: 10, endWidth: 15,
backgroundColor: "#A5BA28", border: { color: "#A5BA28" }
},
//Adding range 3
{
placement: "near",
distanceFromScale: 20,
startValue: 20, endValue: 40, startWidth: 15, endWidth: 20,
backgroundColor: "#FEBE48", border: { color: "#FEBE48" }
},
//Adding range 4
{
placement: "near",
distanceFromScale: 20,
startValue: 40, endValue: 60, startWidth: 20, endWidth: 25,
backgroundColor: "Red", border: { color: "Red" }
}]
}]
});
});Execute the above code to render the following output.