Marker Pointers
10 Jan 201824 minutes to read
Marker Pointer value points out the actual value set in the Linear Gauge. You can set values for various pointer attributes such as value, type, length, width, border and color in pointer collection. You can also customize the pointers to improve the appearance of gauge.
Adding marker pointer collection
You can add Marker Pointer collection directly to the scale object. To add pointer collection in a gauge control refer the following code example.
<div id="LinearGauge1"></div>$(function () {
//For Linear gauge rendering
$("#LinearGauge1").ejLinearGauge({
value: 78,
//Adding scale collection
scales: [{
border: { color: "transparent", width: 0 },
showBarPointers: true,
//Adding bar pointer collection
barPointers: [{ width: 5, backgroundColor: "Grey" }],
//Adding marker pointer collection
markerPointers: [{
width: 10,
length: 10,
backgroundColor: "Grey",
distanceFromScale: -12
}],
//Adding tick collection
ticks: [{
type: "majorinterval", width: 2,
color: "#8c8c8c", distanceFromScale: { x: 7, y: 0 }
},
{
type: "minorinterval", width: 1, height: 6,
color: "#8c8c8c", distanceFromScale: { x: 7, y: 0 }
}]
}]
});
});Execute the above code to render the following output.
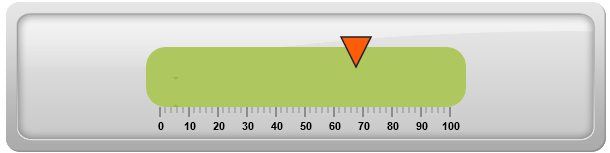
Add marker pointer value
The value property is the important element in the marker pointer collection which indicates the gauge value. Real purpose of the Linear Gauge is based on the pointer value. You can set the pointer value either directly during rendering the control or it can be achieved by public method.
<div id="LinearGauge1"></div>$(function () {
//For render linear gauge
$("#LinearGauge1").ejLinearGauge({
enableAnimation: false,
width: 600,
height: 150,
orientation: "Horizontal",
labelColor: "Black",
enableResize: true,
//For Adding frame collection
frame: {
backgroundImageUrl: "../images/gauge/Gauge_linear_light1.png"
},
//For Adding scale collection
scales: [{
backgroundColor: "#AEC75F",
direction: ej.datavisualization.LinearGauge.Directions.Clockwise,
type: "roundedrectangle",
border: { color: "#AEC75F", width: 30 },
//Adding marker pointer collection
markerPointers: [{
width: 30, length: 30, backgroundColor: "#FE5C09",
distanceFromScale: 20, placement: "near",
value: 67.5
}],
//Adding label collection
labels: [{ angle: 90, distanceFromScale: { x: 0, y: 100 } }],
//Adding tick collection
ticks: [{
type: "majorinterval", width: 2,
color: "#8c8c8c", distanceFromScale: { x: 45, y: -1 }
},
{
type: "minorinterval", width: 1, height: 6,
color: "#8c8c8c", distanceFromScale: { x: 45, y: -1 }
}]
}]
});
});Execute the above code to render the following output.
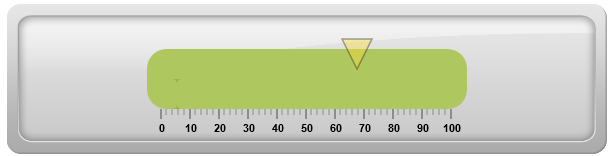
Pointer Styles
Appearance
-
Based on the value, the pointer points out the label value. You can set the pointer length and width using
lengthandwidthproperty respectively. You can also adjust the opacity of the pointer using theopacityproperty which holds the value between 0 and 1. You can add the gradient effects to the pointer usinggradientobject. -
The marker pointer border is modified with the border object. It contains two border property namely
colorandwidthwhich are used to customize the border color of the scale and border width of the marker pointer. The background color can be customized with attributebackgroundColor.
<div id="LinearGauge1"></div>$(function () {
// For Render Linear gauge
$("#LinearGauge1").ejLinearGauge({
enableAnimation: false,
width: 600,
height: 150,
orientation: "Horizontal",
labelColor: "Black",
enableResize: true,
//Adding Frame object
frame: {
backgroundImageUrl: "../images/gauge/Gauge_linear_light1.png"
},
//Adding Scale collection
scales: [{
backgroundColor: "#AEC75F",
direction: ej.datavisualization.LinearGauge.Directions.Clockwise,
type: "roundedrectangle",
border: { color: "#AEC75F", width: 30 },
//Adding marker pointer collection
markerPointers: [{
//Adding width
width: 30,
//Adding height
length: 30,
//Adding opacity
opacity: 0.4,
//Adding background
backgroundColor: "#FCDD34",
distanceFromScale: 20,
placement: "near",
value: 67.5
}],
//Adding label collection
labels: [{ angle: 90, distanceFromScale: { x: 0, y: 100 } }],
//Adding ticks collection
ticks: [{
type: "majorinterval", width: 2,
color: "#8c8c8c", distanceFromScale: { x: 45, y: -1 }
},
{
type: "minorinterval", width: 1, height: 6,
color: "#8c8c8c", distanceFromScale: { x: 45, y: -1 }
}]
}]
});
});Execute the above code to render the following output.
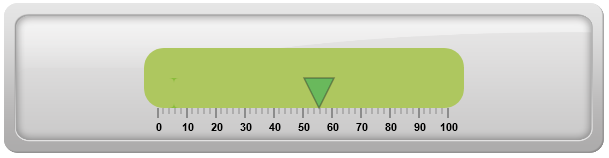
Positioning the pointer
-
You can position the Pointer with two properties, distanceFromScale and placement. The
distanceFromScaleproperty defines the distance between the scale and pointer. -
The
placementproperty is used to locate the pointer with respect to scale either inside or outside the scale or along the scale. It is an enumerable data type.
<div id="LinearGauge1"></div>$(function () {
//For Render Linear gauge
$("#LinearGauge1").ejLinearGauge({
enableAnimation: false,
width: 600,
height: 150,
orientation: "Horizontal",
labelColor: "Black",
enableResize: true,
//For Adding frame
frame: {
backgroundImageUrl: "../images/gauge/Gauge_linear_light1.png"
},
//For Adding Scale
scales: [{
backgroundColor: "#AEC75F",
direction: ej.datavisualization.LinearGauge.Directions.Clockwise,
type: "roundedrectangle",
border: { color: "#AEC75F", width: 30 },
//For Adding marker pointer collection
markerPointers: [{
width: 30, height: 8, opacity: 0.4, backgroundColor: "#01A357",
distanceFromScale: 60,
placement: "near",
value: 55.5
}],
//For Adding label collection
labels: [{ angle: 90, distanceFromScale: { x: 0, y: 100 } }],
//For Adding tick collection
ticks: [{
type: "majorinterval", width: 2,
color: "#8c8c8c", distanceFromScale: { x: 45, y: -1 }
},
{
type: "minorinterval", width: 1, height: 6,
color: "#8c8c8c", distanceFromScale: { x: 45, y: -1 }
}]
}]
});
});Execute the above code to render the following output.
Types
It is possible to change the dimension of the marker pointer. Dimensions available for marker pointer are,
-
Rectangle
-
Triangle
-
Ellipse
-
Diamond
-
Pentagon
-
Circle
-
Slider
-
Pointer
-
Wedge
-
Trapezoid
-
Rounded Rectangle
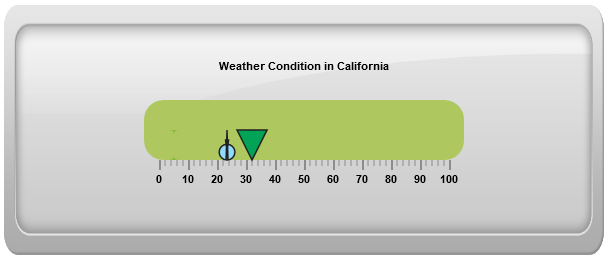
Multiple Marker Pointers
Linear Gauge can contain multiple pointers on it. You can use any combination and any number of pointers in a gauge. That is, a gauge can contain any number of marker pointer and any number of bar pointers. Refer the following code example containing multiple marker pointers.
<div id="LinearGauge1"></div>$(function () {
//For Render Linear gauge
$("#LinearGauge1").ejLinearGauge({
enableAnimation: false,// minimum: -10, maximum: 110,
width: 600,
height: 250,
theme: "flatlight",
orientation: "Horizontal",
labelColor: "Black",
enableResize: true,
//For Adding frame
frame: {
backgroundImageUrl: "../images/gauge/Gauge_linear_light1.png"
},
//For Adding Scale collection
scales: [{
backgroundColor: "#AEC75F", showCustomLabels: true,
direction: ej.datavisualization.LinearGauge.Directions.Clockwise,
type: "roundedrectangle",
border: { color: "#AEC75F", width: 30 },
markerPointers: [
// Adding marker pointer 1
{
width: 30, length: 30, backgroundColor: "#01A357",
distanceFromScale: 60, placement: "near", value: 32.2
},
// Adding marker pointer 2
{
width: 10, length: 30, backgroundColor: "#90DAFB",
distanceFromScale: 60, placement: "near", value: 23.7, type: "circle"
},
// Adding marker pointer 3
{
width: 3, length: 30, backgroundColor: "#90DAFB",
distanceFromScale: 60, placement: "near", value: 23.7, type: "star"
}],
// Adding label collection
labels: [{ angle: 90, distanceFromScale: { x: 0, y: 100 } }],
// Adding tick collection
ticks: [{
type: "majorinterval", width: 2,
color: "#8c8c8c", distanceFromScale: { x: 45, y:-1 }
},
{
type: "minorinterval", width: 1, height: 6,
color: "#8c8c8c", distanceFromScale: { x: 45, y: -1 }
}],
// Adding custom label collection
customLabels: [{
value: "Weather Condition in California", position: {
x: 50, y: 20
},
}]
}]
});
});Execute the above code to render the following output.