- Adding bar pointer collection
- Adding bar pointer value
- Pointer Styles
- Positioning the pointer
- Multiple Bar Pointers
Contact Support
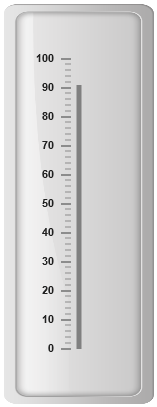
Bar Pointers
9 Jan 201822 minutes to read
Bar Pointer value points out the actual value set in the Linear Gauge as marker pointer. You can set the values of the various bar pointer attributes such as value, width, border and color in bar pointer collection. You can also customize the pointers to improve the appearance of gauge.
Adding bar pointer collection
You can add Bar Pointer collection directly to the scale object. Refer the following code example.
<div id="LinearGauge1"></div>$ (function () {
// For Rendering Linear gauge
$("#LinearGauge1").ejLinearGauge({
//For Adding frame
frame: {
innerWidth: 8,
outerWidth: 10,
backgroundImageUrl:"../images/gauge/Gauge_linear_light.png"
},
value:78,
//For Adding Scale collection
scales: [{
backgroundColor: "transparent",
border: { color: "transparent", width: 0 },
showMarkerPointers: false, showBarPointers: true,
//For Adding bar pointer collection
barPointers: [{ width: 5, backgroundColor: "Grey"}],
//For Adding tick collection
ticks: [{ type: "majorinterval", width: 2,
color: "#8c8c8c", distanceFromScale: { x: 7, y: 0 } },
{ type: "minorinterval", width: 1,height:6,
color: "#8c8c8c", distanceFromScale: { x: 7, y: 0 } }]
}]
});
});Execute the above code to render the following output.
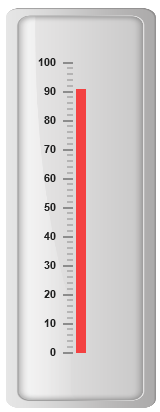
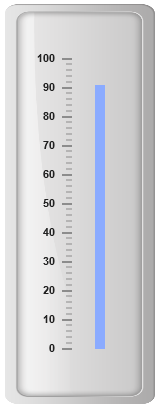
Adding bar pointer value
Bar pointer value is also important element in the Linear Gauge as it indicates the gauge value. Real purpose of the Linear Gauge is based on the pointer value. You can set the bar pointer value either directly during rendering the control or it can be achieved by public method.
<div id="LinearGauge1"></div>$(function () {
// For Rendering Linear gauge
$("#LinearGauge1").ejLinearGauge({enableAnimation:false,
//For Adding frame
frame: {
innerWidth: 8,
outerWidth: 10,
backgroundImageUrl: "../images/gauge/Gauge_linear_light.png"
},
//For Adding Scales
scales: [{
backgroundColor: "transparent",
border: { color: "transparent", width: 0 },
showMarkerPointers: false, showBarPointers: true,
//For Adding bar pointer collection
barPointers: [{
width: 5,
backgroundColor: "Grey",
value:91
}],
//For Adding tick collection
ticks: [{
type: "majorinterval", width: 2,
color: "#8c8c8c", distanceFromScale: { x: 7, y: 0 }
},
{
type: "minorinterval", width: 1, height: 6,
color: "#8c8c8c", distanceFromScale: { x: 7, y: 0 }
}]
}]
});
});Execute the above code to render the following output.
Pointer Styles
Appearance
-
Based on the value, the bar pointer points out the label value. You can set the bar pointer width using
widthproperty and you can also adjust the opacity of the pointer usingopacityproperty that holds the value between 0 and 1. You can add the gradient effects to the pointer usinggradientobject. -
The marker pointer border is modified with the object border. It has two border property,
colorandwidthwhich are used to customize the border color of the scale and border width of the marker pointer. The background color can be customized with attributebackgroundColor.
<div id="LinearGauge1"></div>$(function () {
// For Rendering Linear gauge
$("#LinearGauge1").ejLinearGauge({enableAnimation:false,
// Adding Frame object
frame: {
innerWidth: 8,
outerWidth: 10,
backgroundImageUrl: "../images/gauge/Gauge_linear_light.png"
},
// Adding Scale collection
scales: [{
backgroundColor: "transparent",
border: { color: "transparent", width: 0 },
showMarkerPointers: false, showBarPointers: true,
// Adding bar pointer collection
barPointers: [{
width: 10,
backgroundColor: "Red",
border: { color: "#860201", width: 2 },
opacity:0.7,
value: 91 }],
// Adding tick collection
ticks: [{
type: "majorinterval", width: 2,
color: "#8c8c8c", distanceFromScale: { x: 7, y: 0 }
},
{
type: "minorinterval", width: 1, height: 6,
color: "#8c8c8c", distanceFromScale: { x: 7, y: 0 }
}]
}]
});
});Execute the above code to render the following output.
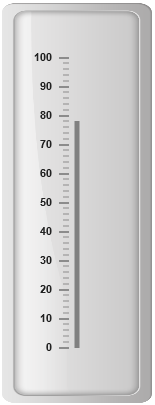
Positioning the pointer
-
Bar pointer can be positioned with two properties such as distanceFromScale and placement. The
distanceFromScaleproperty defines the distance between the scale and pointer element. -
The placement property is used to locate the pointer with respect to scale either inside or outside the scale or along the scale. It is an enumerable data type.
<div id="LinearGauge1"></div>$(function () {
// For Rendering Linear gauge
$("#LinearGauge1").ejLinearGauge({enableAnimation:false,
//Adding frame object
frame: {
innerWidth: 8,
outerWidth: 10,
backgroundImageUrl: "../images/gauge/Gauge_linear_light.png"
},
//Adding Scale collection
scales: [{
backgroundColor: "transparent",
border: { color: "transparent", width: 0 },
showMarkerPointers: false, showBarPointers: true,
//Adding bar pointer collection
barPointers: [{
width: 10,
backgroundColor: "#8BABFF",
value: 91,
placement: "near",
distanceFromScale: 20
}],
//Adding tick collection
ticks: [{
type: "majorinterval", width: 2,
color: "#8c8c8c", distanceFromScale: { x: 7, y: 0 }
},
{
type: "minorinterval", width: 1, height: 6,
color: "#8c8c8c", distanceFromScale: { x: 7, y: 0 }
}]
}]
});
});Execute the above code to render the following output.
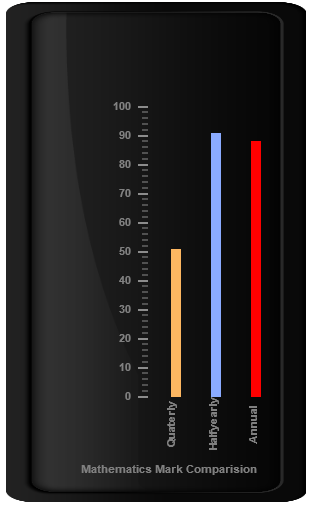
Multiple Bar Pointers
Linear Gauge can contain multiple bar pointers on it. You can use any combination and any number of pointers in a gauge. That is, a Gauge can contain any number of marker pointer and any number of bar pointers. Refer the following code example containing multiple bar pointers.
<div id="LinearGauge1"></div>$(function () {
// For Rendering Linear gauge
$("#LinearGauge1").ejLinearGauge({
enableAnimation: false, height: 500,
width: 300, labelColor: "Grey",
//Adding frame object
frame: {
innerWidth: 8,
outerWidth: 10,
backgroundImageUrl: "../images/gauge/Gauge_linear_dark1.png"
},
//Adding scale collection
scales: [{
backgroundColor: "transparent",
border: { color: "transparent", width: 0 },
showMarkerPointers: false, showBarPointers: true, showCustomLabels: true,
//Adding bar pointer collection
barPointers: [
//Adding bar pointer 1
{
width: 10, backgroundColor: "#8BABFF",
value: 91, placement: "near", distanceFromScale: 60
},
//Adding bar pointer 2
{
width: 10, backgroundColor: "#FDB761", value: 51,
placement: "near", distanceFromScale: 20
},
//Adding bar pointer 3
{
width: 10, backgroundColor: "Red", value: 88,
placement: "near", distanceFromScale: 100
}
],
//Adding tick collection
ticks: [{
type: "majorinterval", width: 2,
color: "#8c8c8c", distanceFromScale: { x: 7, y: 0 }
},
{
type: "minorinterval", width: 1, height: 6,
color: "#8c8c8c", distanceFromScale: { x: 7, y: 0 }
}],
//Adding custom label collection
customLabels: [
{
value: "Mathematics Mark Comparison",
position: { x: 55, y: 97 }
},
{ value: "Half yearly", position: { x: 72, y: 87 }, textAngle: 90 },
{ value: "Quarterly", position: { x: 56, y: 87 }, textAngle: 90 },
{ value: "Annual", position: { x: 87, y: 87 }, textAngle: 90 }]
}]
});
});Execute the above code to render the following output.