How can I help you?
UML Class Diagram Shapes
Class diagram is used to represent the static view of an application. The class diagrams are widely used in the modelling of object oriented systems because they are the only UML diagrams which can be mapped directly with object oriented languages.
Diagram supports to generate the class diagram shapes from business logic.
The UML class diagram shapes are explained as follows.
Class
A Class describes a set of objects that shares the same specifications of features,constraints and semantics.To define a class object, you need to define the classifier as “class”.
Also, you need to define the name, attributes and methods of the class using the class property of node.
The following code example illustrates how to create a class.
<div ng-controller="diagramCtrl">
    <ej-diagram id="diagram"
                e-height="500px"
                e-width="700px"
                e-nodes="nodes">
    </ej-diagram>
</div>var nodes = [{
name: "Patient",
offsetX: 100,
offsetY: 100,
borderWidth: 2,
borderColor: "black",
//Sets type of shape
type: "umlclassifier",
//Sets the type of classifier
classifier: ej.datavisualization.Diagram.ClassifierShapes.Class,
//Sets the class object
"class": {
//Name of a class header
name: "Patient",
//Sets the collection of attributes
attributes: [{
name: "accepted",
type: "Date",
//sets the scope value for class member
scope: "protected"
},
{
name: "prescription",
type: "String[*]"
}
],
//Sets the collection of methods
methods: [{
name: "getHistory",
//sets the arguments for methods
arguments: [{
name: "Date"
}],
type: "History"
}]
},
}];
syncApp.controller('diagramCtrl', function($scope) {
//Sets nodes collection to Diagram model.
$scope.nodes = nodes;
});
NOTE
The default value for the property
classifieris “class”.
Interface
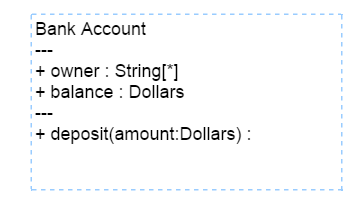
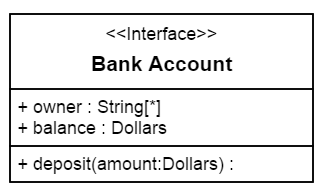
An Interface is a kind of classifier that represents a declaration of a set of coherent public features and obligations. To create an interface, you need to define the classifier property as “interface”.
Also, you need to define the methods and members of the interface using the interface property of the node.
The following code example illustrates how to create an interface.
var nodes = [{
    name: "Bank",
    offsetX: 100,
    offsetY: 100,
    borderWidth: 2,
    borderColor: "black",
    //Sets type of shape
    type: "umlclassifier",
    //Sets the type of classifier
    classifier: ej.datavisualization.Diagram.ClassifierShapes.Interface,
    //Sets the interface object
    interface: {
        name: "Bank Account",
            attributes: [{
                    name: "ownar",
                    type: "String[*]"
                },
                {
                    name: "balance",
                    type: "Dollars"
                }
            ],
            methods: [{
                name: "deposit",
                arguments: [{
                    name: "amount",
                    type: "Dollars"
                }],
            }]
    },
}];

syncApp.controller('diagramCtrl', function($scope) {
    //Sets nodes collection to Diagram model.
    $scope.nodes = nodes;
});
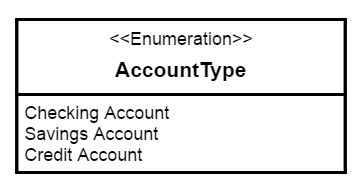
Enumeration
To define an enumeration, you need to define the classifier property of node as “enumeration”. Also you need to define the name and members of the enumeration using the enumeration property of node.
The following code example illustrates how to create an enumeration.
var nodes = [{
     name: "Enums",
     offsetX: 100,
     offsetY: 100,
     borderWidth: 2,
     borderColor: "black",
     //Sets type of shape
     type: "umlclassifier",
     //Sets the type of classifier
     classifier: ej.datavisualization.Diagram.ClassifierShapes.Enumeration,
     //Sets the enumeration object
     enumeration: {
         name: "AccountType",
         //sets the members of enumeration
         members: [{
                 name: "Checking Account"
             },
             {
                 name: "Savings Account"
             },
             {
                 name: "Credit Account"
             }
         ]
     }
 }]

 syncApp.controller('diagramCtrl', function($scope) {
     //Sets nodes collection to Diagram model.
     $scope.nodes = nodes;
 });
Relationships
A relationship is a general term covering the specific types of logical connections found on class diagrams.
The list of relationships are demonstrated as follows.
| shape | Image |
|---|---|
| Association |  |
| Aggregation | 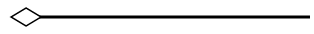 |
| Composition | 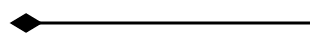 |
| Inheritance |  |
| Dependency |  |
Association
Association is basically a set of links that connects elements of an UML model. The type of association are as follows.
- Directional
- BiDirectional
The association property allows you to define the type of association. The default value of association is “Directional”. The following code example illustrates how to create an association.
<div ng-controller="diagramCtrl">
    <ej-diagram id="diagram" e-height="500px" e-width="700px" e-connectors="connectors">
    </ej-diagram>
</div>var connectors = [{
name: "connect1",
sourcePoint: {
x: 100,
y: 200
},
targetPoint: {
x: 300,
y: 200
},
segments: [{
type: "straight"
}],
shape: {
type: "umlclassifier",
//Sets the type of the relationships as association
relationship: ej.datavisualization.Diagram.ClassifierShapes.Association,
//Sets the type of association
association: ej.datavisualization.Diagram.AssociationFlows.Directional,
}
}];
syncApp.controller('diagramCtrl', function($scope) {
//Sets connectors collection to Diagram model.
$scope.connectors = connectors;
});
NOTE
The default value for the property
associationis “directional”.
Aggregation
Aggregation is a binary association between a property and one or more composite objects which group together a set of instances.
Aggregation is decorated with a hollow diamond. To create an aggregation shape, you need to define the relationship as “aggregation”.
The following code example illustrates how to create an aggregation.
var connectors = [{
    name: "connect1",
    sourcePoint: {
        x: 100,
        y: 200
    },
    targetPoint: {
        x: 300,
        y: 200
    },
    segments: [{
        type: "straight"
    }],
    shape: {
        type: "umlclassifier",
        //Sets the type of the relationships as aggregation
        relationship: ej.datavisualization.Diagram.ClassifierShapes.Aggregation,
    }
}];

syncApp.controller('diagramCtrl', function($scope) {
    //Sets connectors collection to Diagram model.
    $scope.connectors = connectors;
});
Composition
Composition is a “strong” form of “aggregation”. Composition is decorated with a black diamond.
To create a composition shape, define the relationship property of connector as “composition”.
The following code example illustrates how to create a composition.
var connectors = [{
    name: "connect1",
    sourcePoint: {
        x: 100,
        y: 200
    },
    targetPoint: {
        x: 300,
        y: 200
    },
    segments: [{
        type: "straight"
    }],
    shape: {
        type: "umlclassifier",
        //Sets the type of the relationships as composition
        relationship: ej.datavisualization.Diagram.ClassifierShapes.Composition,
    }
}];

syncApp.controller('diagramCtrl', function($scope) {
    //Sets connectors collection to Diagram model.
    $scope.connectors = connectors;
});
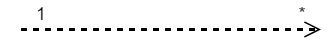
Dependency
Dependency is a directed relationship which is used to show that some UML elements needs or depends on other model elements for specifications. Dependency is shown as dashed line with opened arrow.
To create a dependency, you need to define the relationship property of connector as “dependency”.
The following code example illustrates how to create an dependency.
var connectors = [{
    name: "connect1",
    sourcePoint: {
        x: 100,
        y: 200
    },
    targetPoint: {
        x: 300,
        y: 200
    },
    segments: [{
        type: "straight"
    }],
    shape: {
        type: "umlclassifier",
        //Sets the type of the relationships as dependency
        relationship: ej.datavisualization.Diagram.ClassifierShapes.Dependency,
    }
}]

syncApp.controller('diagramCtrl', function($scope) {
    //Sets connectors collection to Diagram model.
    $scope.connectors = connectors;
});
Inheritance
Inheritance is also called as “generalization”. Inheritance is a binary taxonomic directed relationship between a more general classifier(super class) and a more specific classifier(subclass).
Inheritance is shown as a line with hollow triangle.
To create a inheritance, you need to define the relationship as “inheritance”.
The following code example illustrates how to create an inheritance.
var connectors = [{
    name: "connect1",
    sourcePoint: {
        x: 100,
        y: 200
    },
    targetPoint: {
        x: 300,
        y: 200
    },
    segments: [{
        type: "straight"
    }],
    shape: {
        type: "umlclassifier",
        //Sets the type of the relationships as inheritance
        relationship: ej.datavisualization.Diagram.ClassifierShapes.Inheritance,
    }
}];

syncApp.controller('diagramCtrl', function($scope) {
    //Sets connectors collection to Diagram model.
    $scope.connectors = connectors;
});
Multiplicity
Multiplicity is a definition of an inclusive interval of non-negative integers to specify the allowable number of instances of described element. The type of multiplicity are as follows.
- OneToOne
- ManyToOne
- OneToMany
- ManyToMany
By default the multiplicity will be considered as “OneToOne”. You can customize it using the multiplicity property of connector.
The following code example illustrates how to customize the multiplicity.
var connectors = [{
    name: "connect1",
    sourcePoint: {
        x: 100,
        y: 200
    },
    targetPoint: {
        x: 300,
        y: 200
    },
    labels: [{
        margin: {
            top: 10,
            left: 10,
            right: 10,
            bottom: 20
        }
    }],
    segments: [{
        type: "straight"
    }],
    shape: {
        type: "umlclassifier",
        relationship: ej.datavisualization.Diagram.ClassifierShapes.Dependency,
        //Sets the type of multiplicity
        multiplicity: {
            //Sets the type of multiplicity
            type: "onetomany",
            //Sets the source label
            source: {
                //Sets the optionality/cardinality for the connector
                optional: true,
                //Specifies interval for number of instances of described element
                lowerBounds: 89,
                upperBounds: 67
            },
            //Sets the target label
            target: {
                optional: true,
                lowerBounds: 78,
                upperBounds: 90
            }
        }
    }
}]


syncApp.controller('diagramCtrl', function($scope) {
    //Sets connectors collection to Diagram model.
    $scope.connectors = connectors;
});
Editing
You can edit the name, attributes and methods of the class diagram shapes just with a double click. When you double click a class diagram shape, a text editor with three different sections(name, members, methods) will be generated.
The string “—” acts as a splitter between the three sections.
The following image illustrates how the text editor will be.