- Page size and appearance
- MultiplePage and PageBreaks
- Boundary Constraints
Contact Support
Page Settings
28 Jun 20176 minutes to read
Page settings enable to customize the appearance, width, and height of the Diagram page.

Page size and appearance
The size and appearance of the Diagram pages can be customized with the pageSettings property.
The pageWidth and pageHeight properties of page settings define the size of the page. In addition to that, you can customize the appearance of the page with backgroundImage and set of appearance specific properties.
To explore those properties, refer Page Settings.
You can also customize the appearance of off-page regions with the property backgroundColor.
NOTE
When the pageWidth and pageHeight are not specified, the rectangular region that completely fits all nodes and connectors are considered as page size.
BackgroundImage
You can stretch and align the background image anywhere over the diagram area.
The source property of backgroundImage allows you to set the path of the image. The scale and the align properties help to stretch/align the background images.
To explore the backgroundImage properties, refer Background Image.
The following code illustrates how to stretch and align the background image.
<div ng-controller="diagramCtrl">
    <div>
        <ej-diagram id="diagramCore" e-height="500px" e-width="700px" e-nodes="nodes" e-backgroundcolor="backgroundColor" e-backgroundImage="backgroundImage" e-pagesettings-pageheight="pageSettings.pageHeight"
        e-pagesettings-pagewidth="pageSettings.pageWidth" e-pagesettings-pagebackgroundcolor="pageSettings.pageBackgroundColor" e-pagesettings-pageborderwidth="pageSettings.pageBorderWidth"
        e-pagesettings-pagebordercolor="pageSettings.pageBorderColor" e-pagesettings-pagemargin="pageSettings.pageMargin" e-pagesettings-showpagebreak="pageSettings.showPageBreak"
        e-pagesettings-pageorientation="pageSettings.pageOrientation" e-pagesettings-multiplepage="pageSettings.multiplePage">
        </ej-diagram>
    </div>
</div>syncApp.controller('diagramCtrl', function($scope) {
$scope.backgroundColor = "whitesmoke";
$scope.backgroundImage = {
alignment: ej.datavisualization.Diagram.ImageAlignment.XMidYMin,
scale: ej.datavisualization.Diagram.scaleConstraints.Meet,
source: "airplane.png"
}
$scope.pageSettings = {
//Sets page size
pageWidth: 500,
pageHeight: 500,
//Customizes the appearance of page
pageBorderWidth: 4,
pageBackgroundColor: "White",
pageBorderColor: "lightgray",
pageMargin: 25,
showPageBreak: true,
multiplePage: true,
pageOrientation: ej.datavisualization.Diagram.PageOrientations.Portrait
};
});MultiplePage and PageBreaks
When MultiplePage is enabled, size of the page dynamically increases or decreases in multiples of page width and height and completely fits diagram within the page boundaries. Page Breaks is used as a visual guide to see how pages are split into multiple pages.
multiplePage and showPageBreak properties of page settings allow you to enable/disable multiple pages and page breaks respectively.
The following code illustrates how to enable multiple page and page break lines.
<div ng-controller="diagramCtrl">
    <div>
        <ej-diagram id="diagramCore" e-height="500px" e-width="700px" e-pagesettings-pageheight="pageSettings.pageHeight" e-pagesettings-pagewidth="pageSettings.pageWidth"
        e-pagesettings-showpagebreak="pageSettings.showPageBreak" e-pagesettings-multiplepage="pageSettings.multiplePage">
        </ej-diagram>
    </div>
</div>syncApp.controller('diagramCtrl', function($scope) {
$scope.pageSettings = {
//Sets page size
pageWidth: 500,
pageHeight: 500,
//Enables the page break lines
showPageBreak: true,
//Enables the multiple page
multiplePage: true,
};
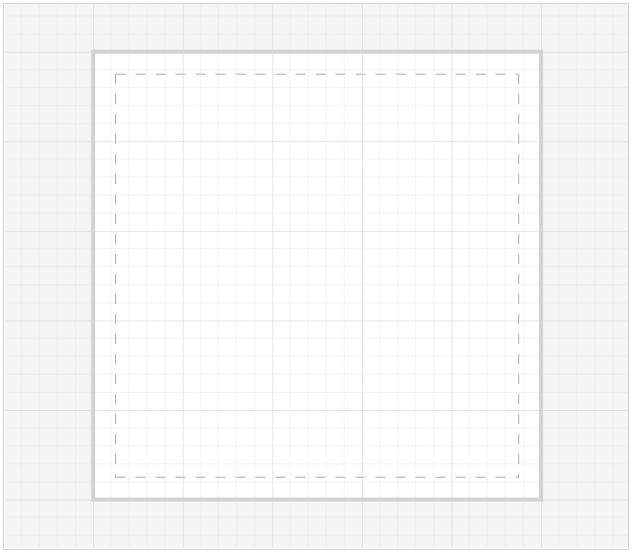
});Boundary Constraints
Diagram provides support to restrict/customize the interactive region, out of which the elements cannot be dragged, resized or rotated.
boundaryConstraints property of page settings allows you to customize the interactive region. To explore the boundary constraints, refer refer Boundary Constraints.
The following code example illustrates how to define boundaryConstraints.
<div ng-controller="diagramCtrl">
    <div>
        <ej-diagram id="diagramCore" e-height="500px" e-width="700px" e-pagesettings-pageheight="pageSettings.pageHeight"
         e-pagesettings-pagewidth="pageSettings.pageWidth" e-pagesettings-boundaryConstraints="pageSettings.boundaryConstraints" </ej-diagram>
    </div>
</div>syncApp.controller('diagramCtrl', function($scope) {
$scope.pageSettings = {
//Sets page size
pageWidth: 500,
pageHeight: 500,
//Allows to drag within the diagram content
boundaryConstraints: ej.datavisualization.Diagram.BoundaryConstraints.Diagram;
};
});