How can I help you?
Getting Started
Getting started with your Essential Angular 1.0 Diagram is easy.
Adding Script Reference
Create an HTML page and add the scripts references in the order mentioned in the following code example.
<!DOCTYPE html>
<html ng-app="defaultApp">

<head>
    <link rel="stylesheet" href="http://cdn.syncfusion.com/14.3.0.49/js/web/bootstrap-  theme/ej.web.all.min.css" />
    <script src="https://code.jquery.com/jquery-3.0.0.min.js"></script>
    <script src="http://cdn.syncfusion.com/js/assets/external/jsrender.min.js" type="text/javascript"></script>
    <script src="https://ajax.aspnetcdn.com/ajax/jquery.validate/1.14.0/jquery.validate.min.js"></script>
    <script src="https://code.angularjs.org/1.4.0-rc.2/angular.min.js"></script>
    <script src="http://cdn.syncfusion.com/14.3.0.49/js/web/ej.web.all.min.js" type="text/javascript"></script>
    <script src="http://js.syncfusion.com/demos/web/scripts/xljsondata.js" type="text/javascript"></script>
    <script src="https://code.angularjs.org/1.4.0-rc.2/angular-route.min.js"></script>
    <script src="http://cdn.syncfusion.com/14.3.0.49/js/common/ej.widget.angular.min.js"></script>
</head>

<body>
</body>

</html>
In the above code, ej.web.all.min.jsscript reference has been added for demonstration purpose. It is not recommended to use this for deployment purpose, as its file size is larger since it contains all the widgets. Instead, you can use[CSG](http://csg.syncfusion.com/# “”) utility to generate a custom script file with the required widgets for deployment purpose.
Initialize Diagram
Add a placeholder div element that can be used to initialize the diagram widget as shown below.
<!DOCTYPE html>
<html ng-app="defaultApp">

<body ng-controller="diagramCtrl">
    <ej-diagram id="diagramCore" e-height="600px" e-width="100%"></ej-diagram>
</body>

</html><!DOCTYPE html>
<html>
<body>
<script>
var syncApp = angular.module("defaultApp", ["ngRoute", "ejangular"]);
syncApp.controller('diagramCtrl', function($scope, $rootScope) {});
</script>
</body>
</html>This creates an empty diagram
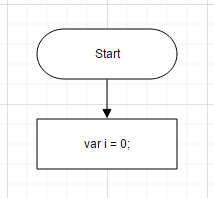
Initialize Nodes and Connectors
Let us create and add a node (JSON data) with specific position, size, label and shape. Connect two or more nodes by adding a connector into diagram.connectors collection with reference to source and target end.
<!DOCTYPE html>
<html ng-app="defaultApp">

<body ng-controller="diagramCtrl">
    <ej-diagram id="diagramCore" e-height="600px" e-width="100%" e-nodes="nodes" e-connectors="connectors"></ej-diagram>
</body>

</html><!DOCTYPE html>
<html>
<body>
<script>
var nodes = [{
// Unique name for the node
name: "Start",
// Position of the node
offsetX: 300,
offsetY: 50,
// Size of the node
width: 140,
height: 50,
// Text(label) added to the node
labels: [{
text: "Start"
}],
// Shape for the node
type: "flow",
shape: "terminator"
},
{
name: "Init",
offsetX: 300,
offsetY: 140,
width: 140,
height: 50,
labels: [{
text: "var i = 0;"
}],
type: "flow",
shape: "process"
}
];
var connectors = [{
// Unique name for the connector
name: "connector1",
// Source and Target node's name to which connector needs to be connected.
sourceNode: "Start",
targetNode: "Init",
// An empty orthogonal segment
segments: [{
type: "orthogonal"
}]
}];
var syncApp = angular.module("defaultApp", ["ngRoute", "ejangular"]);
syncApp.controller('diagramCtrl', function($scope, $rootScope) {
$scope.nodes = nodes;
$scope.connectors = connectors;
});
</script>
</body>
</html>NOTE
labelsproperty is an array, which indicates that more than one label can be added to a node.
Added nodes and connector connecting node will be displayed in diagram as shown below.
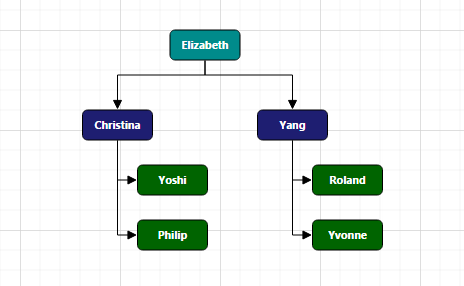
Business object (Employee information)
- Define Employee Information as JSON data. The following code example shows an employee array whose,
-
Nameis used as a unique identifier and -
ReportingPersonis used to identify the person to whom an employee report to, in the organization.
-
var data = [{
        Name: "Elizabeth",
        Role: "Director"
    },
    {
        Name: "Christina",
        ReportingPerson: "Elizabeth",
        Role: "Manager"
    },
    {
        Name: "Yoshi",
        ReportingPerson: "Christina",
        Role: "Lead"
    },
    {
        Name: "Philip",
        ReportingPerson: "Christina",
        Role: "Lead"
    },
    {
        Name: "Yang",
        ReportingPerson: "Elizabeth",
        Role: "Manager"
    },
    {
        Name: "Roland",
        ReportingPerson: "Yang",
        Role: "Lead"
    },
    {
        Name: "Yvonne",
        ReportingPerson: "Yang",
        Role: "Lead"
    }
];
Map data source
- You can configure this “Employee Information” with Diagram, so that the node and connector are automatically generated using mapping properties. The following code examples show how dataSourceSetting is used to map id and parent with property name identifiers for employee information.
<ej-diagram id="diagram" e-height="450px"
                            e-layout-type="layout.type"
                            e-layout-orientation="layout.orientation"
                            e-layout-horizontalspacing="layout.horizontalSpacing"
                            e-layout-verticalspacing="layout.verticalSpacing"
                            e-layout-marginx="layout.marginX"
                            e-layout-marginy="layout.marginY"
                            e-nodetemplate="nodeTemplate"
                            e-datasourcesettings-datasource="dataSourceSettings.dataSource"
                            e-datasourcesettings-parent="dataSourceSettings.parent"
                            e-datasourcesettings-id="dataSourceSettings.id"
                            e-datasourcesettings-root="dataSourceSettings.root"
                            e-defaultsettings-node="defaultSettings.node"
                            e-defaultsettings-connector="defaultSettings.connector">
</ej-diagram>
Visualize employee
Following code examples indicate how to define the default appearance of node and connector using defaultSetting. The NodeTemplate is used to update each node based on employee data.
//To represent the roles
var codes = {
    Director: "rgb(0, 139,139)",
    Manager: "rgb(30, 30,113)",
    Lead: "rgb(0, 100,0)"
}

// Bind custom data with node
function nodeTemplate(diagram, node) {
    node.labels[0].text = node.Name;
    node.fillColor = codes[node.Role];
}
var syncApp = angular.module("defaultApp", ["ngRoute", "ejangular"]);
syncApp.controller('diagramCtrl', function($scope, $rootScope) {
    $scope.layout = {
        type: "organizationalchart",
        orientation: "toptobottom",
        horizontalSpacing: 25,
        verticalSpacing: 35,
        marginX: 3,
        marginY: 3
    };
    $scope.defaultSettings = {
        node: {
            constraints: ej.datavisualization.Diagram.NodeConstraints.Select | ej.datavisualization.Diagram.NodeConstraints.PointerEvents,
            fillColor: "#88C65C",
            width: 100,
            height: 40,
            borderColor: "black",
            borderWidth: 1,
            labels: [{
                name: "label1",
                fontColor: "white",
                fontSize: 12,
                margin: {
                    left: 10,
                    right: 10
                }
            }]
        },
        connector: {
            lineColor: "#000000",
            segments: [{
                type: "orthogonal"
            }],
            targetDecorator: {
                shape: "none"
            },
            constraints: ej.datavisualization.Diagram.ConnectorConstraints.None
        }
    };
    $scope.nodeTemplate = "nodeTemplate";
    $scope.dataSourceSettings = {
        id: "Name",
        parent: "ReportingPerson",
        dataSource: data
    }
};);- The Employee details are displayed in the Diagram as follows.