How can I help you?
Shapes
Diagram provides support to add different kind of nodes. They are as follows.
- Text Node
- Image Node
- HTML Node
- Native Node
- Basic Shapes
- Flow Shapes
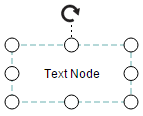
Text
Texts can be added to the Diagram as text nodes. For text nodes, the type should be set as “text”. In addition, you need to define the textBlock object that is used to define the text to be added and to customize the appearance of that text. The following code illustrates how to create a text node.
<div ng-controller="diagramCtrl">
    <ej-diagram id="diagram" e-height="500px" e-width="700px" e-nodes="nodes">
    </ej-diagram>
</div>var diagram = ej.datavisualization.Diagram;
//Creates a html node
var nodes = [{
name: "textNode",
offsetX: 100,
offsetY: 100,
width: 100,
height: 50,
//Sets type of the node
type: diagram.Shapes.Text,
//Customizes the appearances such as text, font, fill, and stroke.
textBlock: {
text: "Text Node",
fontColor: "black",
textAlign: diagram.TextAlign.Center
}
}];
syncApp.controller('diagramCtrl', function($scope) {
//Sets nodes collection to Diagram model.
$scope.nodes = nodes;
});
Image
Diagram allows to add images as image nodes. For image nodes, the type should be set as “image”. In addition, the source property of node enables you to set the image source.
The following code illustrates how an Image node is created.
var diagram = ej.datavisualization.Diagram;
//Creates an Image node
var nodes = [{
    name: "imageNode",
    offsetX: 100,
    offsetY: 100,
    width: 50,
    height: 50,

    //Sets type of the node as Image
    type: diagram.Shapes.Image,

    //Sets url of the image
    source: "sample/syncfusion.png"
}];

syncApp.controller('diagramCtrl', function($scope) {
    //Sets nodes collection to Diagram model.
    $scope.nodes = nodes;
});
NOTE
Deploy your HTML file in the web Application and export the diagram (image node) or else the image node will not be exported in the chrome and Firefox due to security issues. Please refer to the link below.
Link: http://asked.online/draw-images-on-canvas-locally-using-chrome/2546077/
Link1: http://stackoverflow.com/questions/4761711/local-image-in-canvas-in-chrome
Image Alignment
You can stretch and align the image content anywhere but within the node boundary.
The contentAlignment property of node allows to align an image within the node boundary. The scale property of node allows to stretch the image as you desired (either to maintain proportion or to stretch). By default, the scale property of node is set as “meet”.
The following code illustrates how to scale or stretch the content of the image node.
<div ng-controller="diagramCtrl">
    <ej-diagram id="diagram" e-height="500px" e-width="700px" e-nodes="nodes">
    </ej-diagram>
</div>// Defines JSON to create node with image
var nodes = [{
name: "imageNode",
width: 100,
height: 60,
offsetX: 40,
offsetY: 40,
type: ej.datavisualization.Diagram.Shapes.Image,
source: "sample/emlpoyee.png",
borderWidth: 3,
borderColor: "white",
}];
//Initializes Diagram
syncApp.controller('diagramCtrl', function($scope) {
//Sets nodes collection to Diagram model.
$scope.nodes = nodes;
});The following tables illustrates all the possible scale options for the image node
| Values | Image |
|---|---|
| None |  |
| Meet | 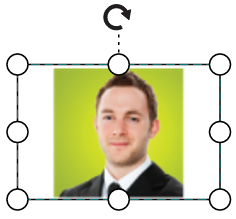 |
| Slice | 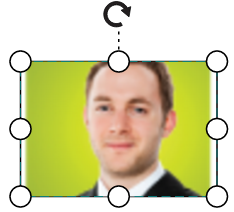 |
| Stretch | 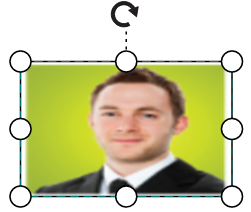 |
HTML
Html elements can be embedded in the Diagram through Html type node. To create a HTML node, you need to set the type of node as “html”. In addition, you need to set the id of HTML template to the templateId property of node. The following code illustrates how an Html node is created.
<!--dependency scripts-->
<script src="http://borismoore.github.io/jsrender/jsrender.min.js"></script>
<!—define html element-->
<script id="htmlTemplate" type="text/x-jsrender">
	<div style="margin-left: 32px; margin-top: 18px">
		<input type="button" value=""/>
	</div>
</script>// Defines JSON to create node with HTML element
var nodes = [{
name: "htmlNode",
offsetX: 100,
offsetY: 100,
width: 120,
height: 60,
//Sets type as Html
type: ej.datavisualization.Diagram.Shapes.Html,
//Sets id of html template
templateId: "htmlTemplate",
value: "Button"
}];
//Initializes Diagram
syncApp.controller('diagramCtrl', function($scope) {
//Sets nodes collection to Diagram model.
$scope.nodes = nodes;
});
NOTE
HTML node cannot be exported to image format, like JPEG, PNG, and BMP. It is by design that while exporting, Diagram is drawn in a canvas. Further, this canvas is exported into image formats. Currently, drawing in a canvas equivalent from all possible HTML is not feasible. Hence, this limitation.
Native
Diagram provides support to embed SVG element into a node. To create a native node, the type node should be set as “native”. Also, you need to define the id of the SVG template by using the templateId property of node. The following code illustrates how a Native node is created.
<!--dependency scripts-->
<script src="http://borismoore.github.io/jsrender/jsrender.min.js"></script>
<!--define html element-->
<script id="svgTemplate" type="text/x-jsrender">
    <g>
        <path d="M 58.813 0 H 3.182 L 30.998 24.141 L 58.813 0 Z M 32.644 34.425 C 32.133 34.87 31.567 35.095 31 35.095 S 29.867 34.87 29.353 34.425 L 1 9.826V 60 H 61 V 9.826 L 32.644 34.425Z"></path>
    </g>
</script>// Defines JSON to create node with HTML element
var nodes = [{
name: "NativeNode",
offsetX: 100,
offsetY: 100,
//Sets type as Native
type: ej.datavisualization.Diagram.Shapes.Native,
//Sets id of SVG element
templateId: "svgTemplate",
labels: [{
text: "Mail"
}]
}];
//Initializes Diagram
syncApp.controller('diagramCtrl', function($scope) {
//Sets nodes collection to Diagram model.
$scope.nodes = nodes;
});
NOTE
Like HTML node, Native node also cannot be exported to image format. Fill color of native node can be overridden by the inline style or fill of the SVG element specified in the template.
SVG content alignment
You can stretch and align the svg content anywhere but within the node boundary.
The contentAlignment property of node allows to align the svg content within the node boundaries. The scale property of node allows to stretch the svg content as you desired(either to maintain proportion or to stretch).By default, the scale property of node is set as “meet”.
The following code illustrates how to scale or stretch the content of the node.
<!--dependency scripts-->
<script src="http://borismoore.github.io/jsrender/jsrender.min.js"></script>
<!--define html element-->
<script id="svgTemplate" type="text/x-jsrender">
    <g>
        <ellipse ry="35" rx="37" id="svg_1" cy="139" cx="215.5" />
    </g>
</script><div ng-controller="diagramCtrl">
<ej-diagram id="diagram" e-height="500px" e-width="700px" e-nodes="nodes">
</ej-diagram>
</div>// Defines JSON to create node with SVG element
var nodes = [{
name: "NativeNode",
width: 100,
height: 60,
offsetX: 40,
offsetY: 40,
fillColor: "darkcyan",
borderWidth: 3,
borderColor: "black",
//Sets type as Native
type: ej.datavisualization.Diagram.Shapes.Native,
//Sets id of SVG element
templateId: "svgTemplate",
}];
//Initializes Diagram
syncApp.controller('diagramCtrl', function($scope) {
//Sets nodes collection to Diagram model.
$scope.nodes = nodes;
});The following tables illustrates all the possible scale options for the node
| Values | Image |
|---|---|
| None |  |
| Meet | 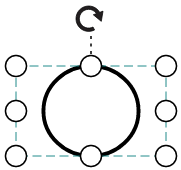 |
| Slice | 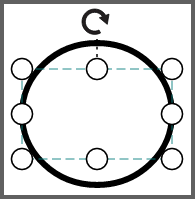 |
| Stretch | 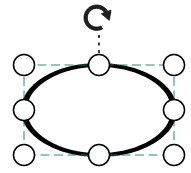 |
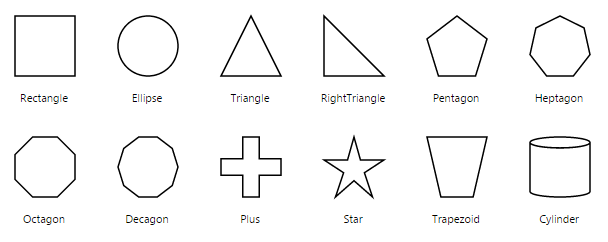
Basic Shapes
The Basic shapes are common shapes that are used to represent the geometrical information visually. To create basic shapes, the type of the node should be set as “basic”. Its shape property can be set with any one of the built-in shape. Basic Shapes.
The following code example illustrates how to create a basic shape.
var nodes = [{
name: "node",
width: 100,
height: 70,
offsetX: 100,
offsetY: 100,
borderWidth: 2,
borderColor: "black",
//Specifies the radius of rounded corner
cornerRadius: 10,
//Sets the type of shape
type: ej.datavisualization.Diagram.Shapes.Basic,
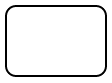
//Sets the type of basic shape
shape: ej.datavisualization.Diagram.BasicShapes.Rectangle
}];
//Initializes Diagram
syncApp.controller('diagramCtrl', function($scope) {
//Sets nodes collection to Diagram model.
$scope.nodes = nodes;
});
NOTE
By default, the
typeproperty of node is set as “basic”.
NOTE
When the
shapeis not set for a basic shape, it is considered a “rectangle”.
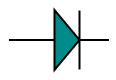
Path
Path node is a commonly used basic shape that allows visually to represent the geometrical information. To create a path node, You need to specify the type as “basic” and the shape as “path”. The pathData property of node allows you to define the path to be drawn. The following code illustrates how a Path node is created.
// Defines JSON to create path node
var nodes = [{
    name: "pathNode",
    offsetX: 100,
    offsetY: 100,
    width: 120,
    height: 60,
    //By default, the type is considered as "basic"

    //Sets shape as Path
    shape: ej.datavisualization.Diagram.BasicShapes.Path,

    //Defines svg pathdata
    pathData: "M35.2441,25 L22.7161,49.9937 L22.7161,0.00657536 L35.2441,25 z M22.7167,25 L-0.00131226,25 M35.2441,49.6337 L35.2441,0.368951 M35.2441,25 L49.9981,25"
}];
//Initializes Diagram
syncApp.controller('diagramCtrl', function($scope) {
    //Sets nodes collection to Diagram model.
    $scope.nodes = nodes;
});
The list of basic shapes are as follows.
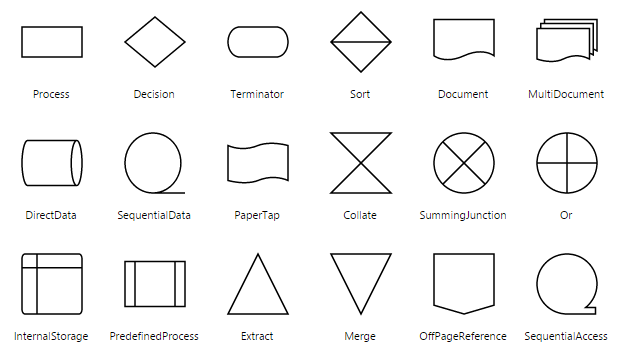
Flow Shapes
The flow shapes are used to represent the process flow. It is used for analyzing, designing, and managing for documentation process. To create a flow shape, you need to specify the type as “flow”. Its shape property can be set with any one of the built-in shape. Flow Shapes and by default, it is considered as “process”. The following code example illustrates how to create a flow shape.
var nodes = [{
    name: "node",
    width: 100,
    height: 100,
    offsetX: 100,
    offsetY: 100,
    borderWidth: 2,
    borderColor: "black",
    //Sets the type of shape
    type: ej.datavisualization.Diagram.Shapes.Flow,
    //Sets the type of flow shape
    shape: ej.datavisualization.Diagram.FlowShapes.Document
}];

//Initializes Diagram
syncApp.controller('diagramCtrl', function($scope) {
    //Sets nodes collection to Diagram model.
    $scope.nodes = nodes;
});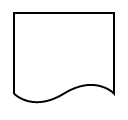
The list of flow shapes are as follows.