How can I help you?
Getting Started
8 Jan 202512 minutes to read
This section explains the steps required to configure the SfSunburstChart and populate it with data, data labels, legends, and title. This section covers only the minimal features that needed to get started with the sunburst chart.
Add sunburst chart references
After installing Essential Studio® for Xamarin, you can find all the required assemblies in the installation folders,
{Syncfusion Installed location}\Essential Studio\16.2.0.41\lib
Add the following SunburstChart assembly reference in the Xamarin.Android project,
lib\android\Syncfusion.SfSunburstChart.Android.dll
Initialize sunburst chart
Import the SfSunburstChart namespace as shown below.
using Syncfusion.SfSunburstChart.Android;Then initialize an empty SunburstChart.
SfSunburstChart sunburstChart = new SfSunburstChart(this);

  SetContentView(sunburstChart);
Initialize view model
In this section, data in the following table is used for demonstration.
| Country | Job description | Job group | Job role | Employees count |
|---|---|---|---|---|
| United States | Sales | Executive | 50 | |
| United States | Sales | Analyst | 40 | |
| United States | Marketing | 40 | ||
| United States | Technical | Testers | 35 | |
| United States | Technical | Developers | Windows | 175 |
| United States | Technical | Developers | Web | 70 |
| United States | Management | 40 | ||
| United States | Accounts | 60 | ||
| India | Technical | Testers | 33 | |
| India | Technical | Developers | Windows | 125 |
| India | Technical | Developers | Web | 60 |
| India | HR Executives | 70 | ||
| India | Accounts | 45 | ||
| Germany | Sales | Executive | 30 | |
| Germany | Sales | Analyst | 40 | |
| Germany | Marketing | 50 | ||
| Germany | Technical | Testers | 40 | |
| Germany | Technical | Developers | Windows | 65 |
| Germany | Technical | Developers | Web | 27 |
| Germany | Management | 33 | ||
| Germany | Accounts | 55 | ||
| UK | Technical | Testers | 25 | |
| UK | Technical | Developers | Windows | 96 |
| UK | Technical | Developers | Web | 55 |
| UK | HR executives | 60 | ||
| UK | Accounts | 30 |
Define a data model that represents the above data in SfSunburstChart.
public class SunburstModel
{
    public string JobDescription { get; set; }
    public string JobGroup { get; set; }
    public string JobRole { get; set; }
    public double EmployeesCount { get; set; }
    public string Country { get; set; }
}
Then, create a view model class, and initialize a list of SunburstModel objects as follows.
public class SunburstViewModel
{
        public ObservableCollection<SunburstModel> DataSource { get; set; }
        public SunburstViewModel()
        {
            this.DataSource = new ObservableCollection<SunburstModel>
            {
                new SunburstModel { Country = "USA", JobDescription = "Sales", JobGroup="Executive", EmployeesCount = 50 },
                new SunburstModel { Country = "USA", JobDescription = "Sales", JobGroup = "Analyst", EmployeesCount = 40 },
                new SunburstModel { Country = "USA", JobDescription = "Marketing", EmployeesCount = 40 },
                new SunburstModel { Country = "USA", JobDescription = "Technical", JobGroup = "Testers", EmployeesCount = 35 },
                new SunburstModel { Country = "USA", JobDescription = "Technical", JobGroup = "Developers", JobRole = "Windows", EmployeesCount = 175 },
                new SunburstModel { Country = "USA", JobDescription = "Technical", JobGroup = "Developers", JobRole = "Web", EmployeesCount = 70 },
                new SunburstModel { Country = "USA", JobDescription = "Management", EmployeesCount = 40 },
                new SunburstModel { Country = "USA", JobDescription = "Accounts", EmployeesCount = 60 },

                new SunburstModel { Country = "India", JobDescription = "Technical", JobGroup = "Testers", EmployeesCount = 33 },
                new SunburstModel { Country = "India", JobDescription = "Technical", JobGroup = "Developers", JobRole = "Windows", EmployeesCount = 125 },
                new SunburstModel { Country = "India", JobDescription = "Technical", JobGroup = "Developers", JobRole = "Web", EmployeesCount = 60 },
                new SunburstModel { Country = "India", JobDescription = "HR Executives", EmployeesCount = 70 },
                new SunburstModel { Country = "India", JobDescription = "Accounts", EmployeesCount = 45 },

                new SunburstModel { Country = "Germany", JobDescription = "Sales", JobGroup = "Executive", EmployeesCount = 30 },
                new SunburstModel { Country = "Germany", JobDescription = "Sales", JobGroup = "Analyst", EmployeesCount = 40 },
                new SunburstModel { Country = "Germany", JobDescription = "Marketing", EmployeesCount = 50 },
                new SunburstModel { Country = "Germany", JobDescription = "Technical", JobGroup = "Testers", EmployeesCount = 40 },
                new SunburstModel { Country = "Germany", JobDescription = "Technical", JobGroup = "Developers", JobRole = "Windows", EmployeesCount = 65 },
                new SunburstModel { Country = "Germany", JobDescription = "Technical", JobGroup = "Developers", JobRole = "Web", EmployeesCount = 27 },
                new SunburstModel { Country = "Germany", JobDescription = "Management", EmployeesCount = 33 },
                new SunburstModel { Country = "Germany", JobDescription = "Accounts", EmployeesCount = 55 },

                new SunburstModel { Country = "UK", JobDescription = "Technical", JobGroup = "Testers", EmployeesCount = 25 },
                new SunburstModel { Country = "UK", JobDescription = "Technical", JobGroup = "Developers", JobRole = "Windows", EmployeesCount = 96 },
                new SunburstModel { Country = "UK", JobDescription = "Technical", JobGroup = "Developers", JobRole = "Web", EmployeesCount = 55 },
                new SunburstModel { Country = "UK", JobDescription = "HR Executives", EmployeesCount = 60 },
                new SunburstModel { Country = "UK", JobDescription = "Accounts", EmployeesCount = 30 }
            };
        }
}
Populate sunburst chart with data
Now, set the DataSource property of the above SunburstViewModel to the ItemsSource property.
Then, add the SunburstHierarchicalLevel to Levels collection. Each hierarchy level is formed based on the property specified in GroupMemberPath property, and each arc segment size is calculated using the ValueMemberPath property.
SfSunburstChart sunburstChart = new SfSunburstChart(this);

  SunburstViewModel dataModel = new SunburstViewModel();
  sunburstChart.ItemsSource = dataModel.DataSource;
  sunburstChart.ValueMemberPath = "EmployeesCount";

  sunburstChart.Levels.Add(new SunburstHierarchicalLevel() { GroupMemberPath = "Country" });
  sunburstChart.Levels.Add(new SunburstHierarchicalLevel() { GroupMemberPath = "JobDescription" });
  sunburstChart.Levels.Add(new SunburstHierarchicalLevel() { GroupMemberPath = "JobGroup" });
  sunburstChart.Levels.Add(new SunburstHierarchicalLevel() { GroupMemberPath = "JobRole" });

  SetContentView(sunburstChart);
Add title
You can add title to the sunburst chart to provide information to users about the data being plotted in the chart. You can set title using the SfSunburstChart.Title property.
  sunburstChart.Title.IsVisible = true;

  sunburstChart.Title.Text= "Employees Count";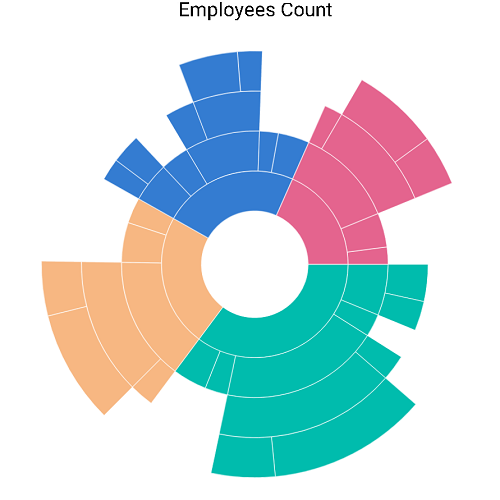
Add legend
You can enable legend using the SfSunburstChart.Legend property.
sunburstChart.Legend.IsVisible = true;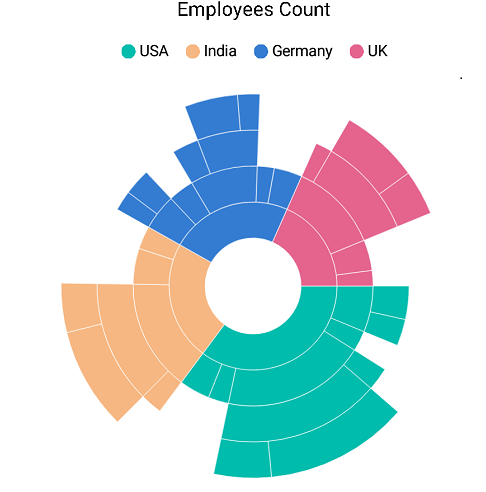
Add data labels
You can add data labels to improve the readability of the sunburst chart. Data labels can be added using the SfSunburstChart.DataLabel property.
sunburstChart.DataLabel.ShowLabel = true;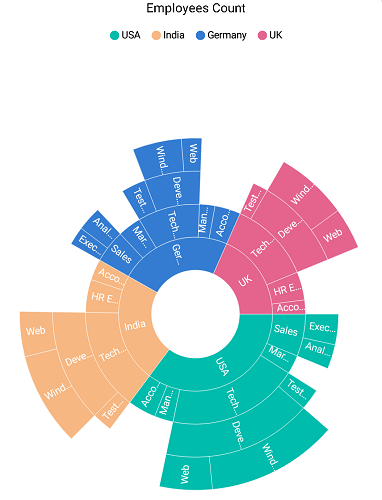
Below is the complete code for generating the following output.
  SfSunburstChart sunburstChart = new SfSunburstChart(this);

  sunburstChart.Title.IsVisible = true;
  sunburstChart.Title.Text = "Employees Count";

  sunburstChart.Legend.IsVisible = true;
  sunburstChart.DataLabel.ShowLabel = true;

  SunburstViewModel dataModel = new SunburstViewModel();
  sunburstChart.ItemsSource = dataModel.DataSource;
  sunburstChart.ValueMemberPath = "EmployeesCount";

  sunburstChart.Levels.Add(new SunburstHierarchicalLevel() { GroupMemberPath = "Country" });
  sunburstChart.Levels.Add(new SunburstHierarchicalLevel() { GroupMemberPath = "JobDescription" });
  sunburstChart.Levels.Add(new SunburstHierarchicalLevel() { GroupMemberPath = "JobGroup" });
  sunburstChart.Levels.Add(new SunburstHierarchicalLevel() { GroupMemberPath = "JobRole" });

  SetContentView(sunburstChart);
The following screenshot depicts the final output.
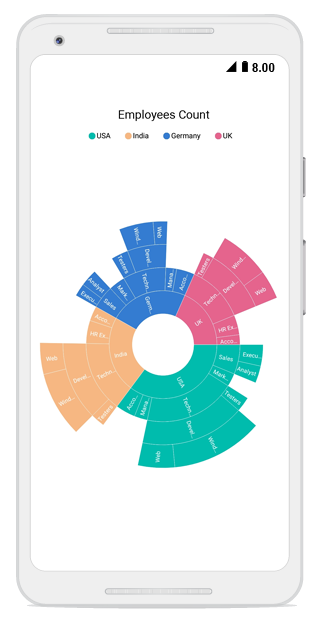
You can find the complete getting started sample from this link.