How can I help you?
Customization
8 Jan 20256 minutes to read
The sunburst chart provides various customizing and styling options to enrich the application.
Palettes
The sunburst chart provides options to apply different kinds of palettes using the ColorModel.
The following palettes are available in the sunburst chart:
- Metro
- Natural
- Pineapple
- TomatoSpectrum
- Custom
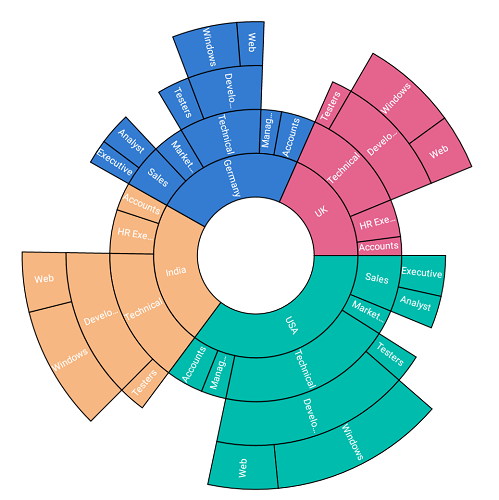
The following code shows applying the TomatoSpectrum Palette.
  SfSunburstChart sunburstChart = new SfSunburstChart(this);

  SunburstViewModel dataModel = new SunburstViewModel();
  sunburstChart.ItemsSource = dataModel.DataSource;
  sunburstChart.ValueMemberPath = "EmployeesCount";

  sunburstChart.DataLabel.ShowLabel = true;

  sunburstChart.Levels.Add(new SunburstHierarchicalLevel() { GroupMemberPath = "Country" });
  sunburstChart.Levels.Add(new SunburstHierarchicalLevel() { GroupMemberPath = "JobDescription" });
  sunburstChart.Levels.Add(new SunburstHierarchicalLevel() { GroupMemberPath = "JobGroup" });
  sunburstChart.Levels.Add(new SunburstHierarchicalLevel() { GroupMemberPath = "JobRole" });

  SunburstChartColorModel colorModel = new SunburstChartColorModel();
  colorModel.Palette = SunburstColorPalette.TomatoSpectrum;
  sunburstChart.ColorModel = colorModel;

  SetContentView(sunburstChart);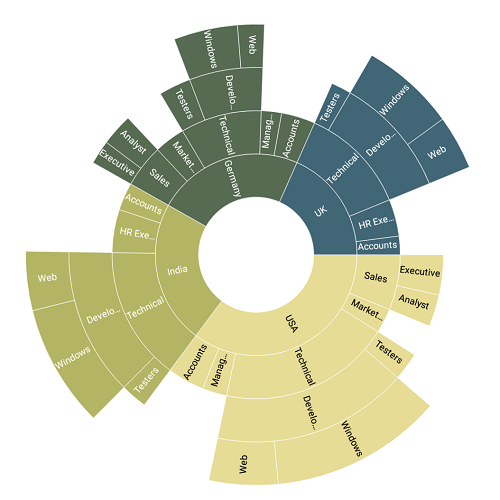
Angle
The start angle and end angle of the sunburst chart can be adjusted by using the StartAngle and EndAngle properties.
  SfSunburstChart sunburstChart = new SfSunburstChart(this);

  SunburstViewModel dataModel = new SunburstViewModel();
  sunburstChart.ItemsSource = dataModel.DataSource;
  sunburstChart.ValueMemberPath = "EmployeesCount";

  sunburstChart.StartAngle = 180;
  sunburstChart.EndAngle = 360;
  sunburstChart.DataLabel.ShowLabel = true;

  sunburstChart.Levels.Add(new SunburstHierarchicalLevel() { GroupMemberPath = "Country" });
  sunburstChart.Levels.Add(new SunburstHierarchicalLevel() { GroupMemberPath = "JobDescription" });
  sunburstChart.Levels.Add(new SunburstHierarchicalLevel() { GroupMemberPath = "JobGroup" });
  sunburstChart.Levels.Add(new SunburstHierarchicalLevel() { GroupMemberPath = "JobRole" });

  SetContentView(sunburstChart);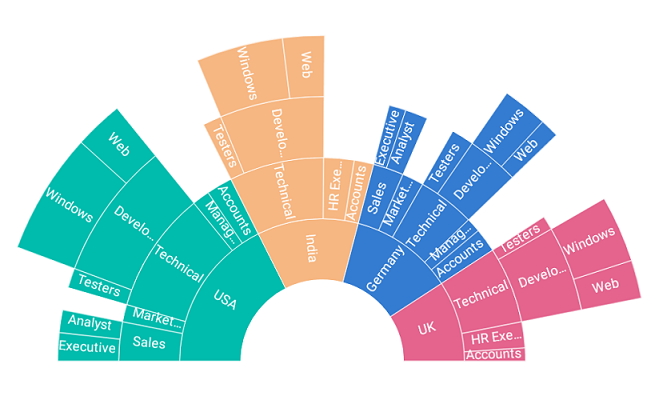
Radius
The sunburst chart allows you to customize the radius by using the Radius property. The default value of this property is 0.9, and the value ranges from 0 to 1.
  SfSunburstChart sunburstChart = new SfSunburstChart(this);

  SunburstViewModel dataModel = new SunburstViewModel();
  sunburstChart.ItemsSource = dataModel.DataSource;
  sunburstChart.ValueMemberPath = "EmployeesCount";

  sunburstChart.Radius = 0.6;
  sunburstChart.DataLabel.ShowLabel = true;

  sunburstChart.Levels.Add(new SunburstHierarchicalLevel() { GroupMemberPath = "Country" });
  sunburstChart.Levels.Add(new SunburstHierarchicalLevel() { GroupMemberPath = "JobDescription" });
  sunburstChart.Levels.Add(new SunburstHierarchicalLevel() { GroupMemberPath = "JobGroup" });
  sunburstChart.Levels.Add(new SunburstHierarchicalLevel() { GroupMemberPath = "JobRole" });

  SetContentView(sunburstChart);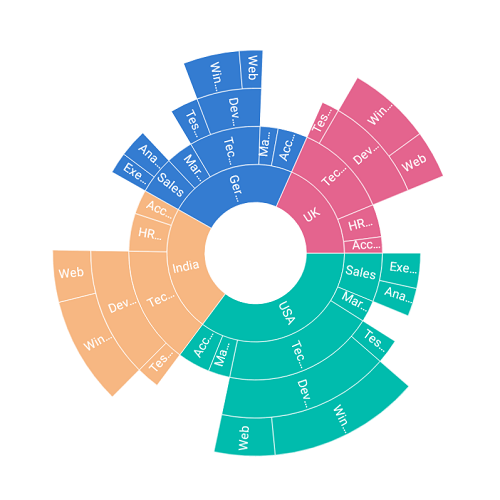
Inner radius
The sunburst chart allows you to customize the inner radius using the InnerRadius property. The default value of this property is 0.2, and the value ranges from 0 to 1.
  SfSunburstChart sunburstChart = new SfSunburstChart(this);

  SunburstViewModel dataModel = new SunburstViewModel();
  sunburstChart.ItemsSource = dataModel.DataSource;
  sunburstChart.ValueMemberPath = "EmployeesCount";

  sunburstChart.InnerRadius = 0.5;
  sunburstChart.DataLabel.ShowLabel = true;

  sunburstChart.Levels.Add(new SunburstHierarchicalLevel() { GroupMemberPath = "Country" });
  sunburstChart.Levels.Add(new SunburstHierarchicalLevel() { GroupMemberPath = "JobDescription" });
  sunburstChart.Levels.Add(new SunburstHierarchicalLevel() { GroupMemberPath = "JobGroup" });
  sunburstChart.Levels.Add(new SunburstHierarchicalLevel() { GroupMemberPath = "JobRole" });

  SetContentView(sunburstChart);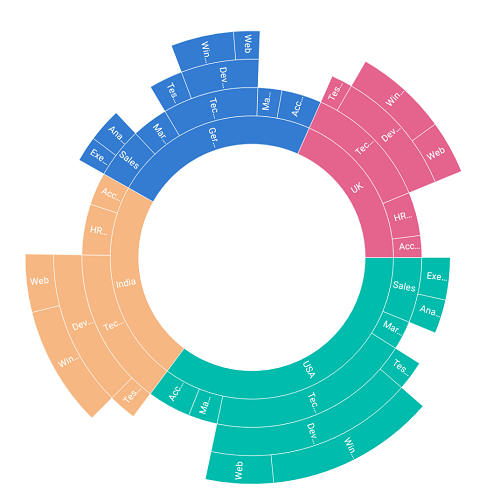
Stroke customization
Stroke color and stroke width of the sunburst chart can be customized using StrokeColor and StrokeWidth properties respectively.
  SfSunburstChart sunburstChart = new SfSunburstChart(this);

  SunburstViewModel dataModel = new SunburstViewModel();
  sunburstChart.ItemsSource = dataModel.DataSource;
  sunburstChart.ValueMemberPath = "EmployeesCount";

  sunburstChart.StrokeColor = Color.Black;
  sunburstChart.StrokeWidth = 2;

  sunburstChart.DataLabel.ShowLabel = true;

  sunburstChart.Levels.Add(new SunburstHierarchicalLevel() { GroupMemberPath = "Country" });
  sunburstChart.Levels.Add(new SunburstHierarchicalLevel() { GroupMemberPath = "JobDescription" });
  sunburstChart.Levels.Add(new SunburstHierarchicalLevel() { GroupMemberPath = "JobGroup" });
  sunburstChart.Levels.Add(new SunburstHierarchicalLevel() { GroupMemberPath = "JobRole" });

  SetContentView(sunburstChart);