How can I help you?
Series in WPF Smith Chart (SfSmithChart)
1 Jul 20224 minutes to read
Chart series is the visual representation of the given data.
The following APIs are used in line series:
- ResistancePath – A string property that represents the X values for the series.
- ReactancePath – A string property that represents the Y values for the series.
- Interior – Represents the brush for the series color.
- StrokeThickness – Represents the thickness of the series outline.
- Palette – Represents the set of pre-defined or custom colors for the series.
The below code example explains how to create a simple LineSeries by using given data
<syncfusion:SfSmithChart x:Name="SmithChart">
     <syncfusion:LineSeries ResistancePath="Resistance" ReactancePath="Reactance"
                                                      ItemsSource="{Binding Data}">
     </syncfusion:LineSeries>
 </syncfusion:SfSmithChart>
//Create SfSmithChart instance
SfSmithChart chart = new SfSmithChart();
//Create line series
LineSeries series = new LineSeries();
series.ItemsSource = Data;
series.ResistancePath = "Resistance";
series.ReactancePath = "Reactance";
series.Label = "TransmissionLine";
//Adding series to SmithChart
chart.Series.Add(series);
this.Grid1.Children.Add(chart);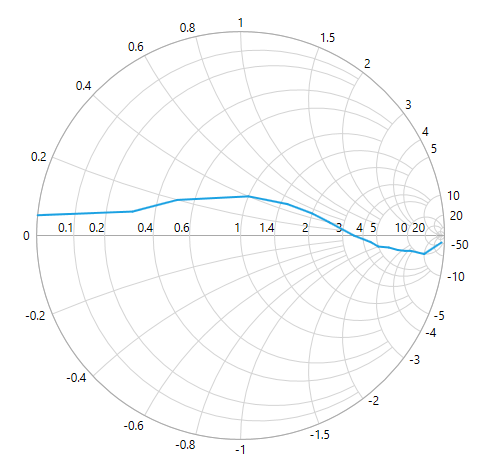
Customizing LineSeries
The line stroke and thickness can be customized by using Interior and StrokeThickness property of line series.
<syncfusion:SfSmithChart x:Name="SmithChart">
     <syncfusion:LineSeries Interior="Orange" StrokeThickness="3">
     </syncfusion:LineSeries>
 </syncfusion:SfSmithChart>
LineSeries series = new LineSeries();
//Customizing line color and thickness
series.StrokeThickness = 3;
series.Interior = new SolidColorBrush(Colors.Orange);
chart.Series.Add(series);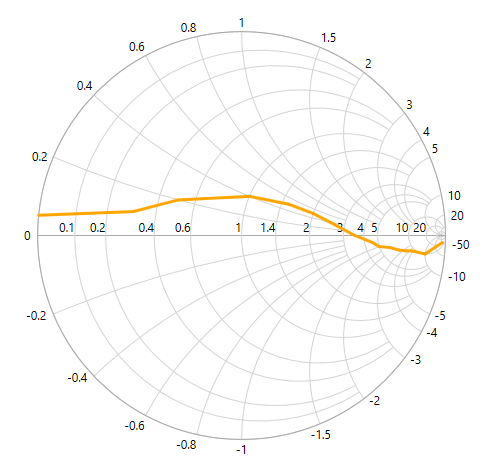
Animation
SfSmithChart allows to animate the chart series on loading whenever the ItemsSource changes. Animation in the chart can be enabled by setting the EnableAnimation property as True and defining the corresponding animation speed with AnimationDuration property.
<syncfusion:SfSmithChart x:Name="SmithChart">
     <syncfusion:LineSeries EnableAnimation="True" AnimationDuration="0:0:3">
     </syncfusion:LineSeries>
 </syncfusion:SfSmithChart>
LineSeries series = new LineSeries();
series.EnableAnimation = true;
series.AnimationDuration = TimeSpan.FromSeconds(2);
chart.Series.Add(series);Series Visibility
To hide the series segment programmatically, set IsSeriesVisible property as False for the specific series.
<syncfusion:SfSmithChart x:Name="SmithChart">
   <syncfusion:LineSeries IsSeriesVisible="False" Label="Transmission-1" ShowMarker="True" ResistancePath="Resistance" ReactancePath="Reactance" ItemsSource="{Binding Data1}">
   </syncfusion:LineSeries>
   <syncfusion:LineSeries Label="Transmission-2" ShowMarker="True" ResistancePath="Resistance" ReactancePath="Reactance" ItemsSource="{Binding Data2}">
   </syncfusion:LineSeries>
</syncfusion:SfSmithChart>
//Create line series1
LineSeries series1 = new LineSeries();
series1.Label = "Transmission-1";
//Hide the series visibility in Chart.
series1.IsSeriesVisible = false;
chart.Series.Add(series1);
//Create line series2
LineSeries series2 = new LineSeries();
series2.Label = "Transmission-2";
chart.Series.Add(series2);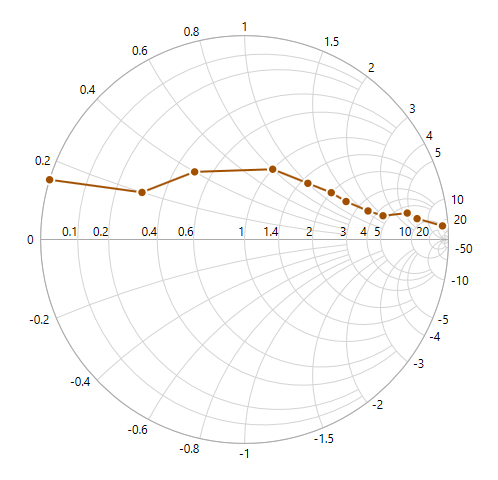
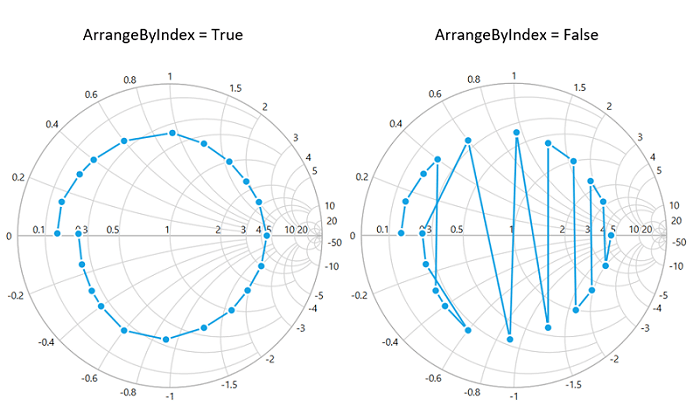
Data plotting customization
By default, the data points are plotted by sorting them based on the resistance values and they can be plotted based on their index value as it is by setting the ArrangeByIndex property as true.
<syncfusion:SfSmithChart>
   <syncfusion:LineSeries ArrangeByIndex="True"/>
</syncfusion:SfSmithChart>
LineSeries series = new LineSeries();
series.ArrangeByIndex = true;
chart.Series.Add(series);