Working with charts using various operations
25 Jun 202624 minutes to read
To quickly start creating a chart in a PowerPoint Presentation using .NET PowerPoint library, please check out this video:
Creating a Chart from scratch
An instance of IOfficeChart can be used to create or modify the charts in PowerPoint Presentation. The following code example demonstrates how to create a simple chart by adding data from scratch.
//Creates a Presentation instance
IPresentation pptxDoc = Presentation.Create();
//Adds a blank slide to the Presentation
ISlide slide = pptxDoc.Slides.Add(SlideLayoutType.Blank);
//Adds chart to the slide with position and size
IPresentationChart chart = slide.Charts.AddChart(100, 10, 700, 500);
//Specifies the chart title
chart.ChartTitle = "Sales Analysis";

//Sets chart data - Row1
chart.ChartData.SetValue(1, 2, "Jan");
chart.ChartData.SetValue(1, 3, "Feb");
chart.ChartData.SetValue(1, 4, "March");

//Sets chart data - Row2
chart.ChartData.SetValue(2, 1, 2010);
chart.ChartData.SetValue(2, 2, 60);
chart.ChartData.SetValue(2, 3, 70);
chart.ChartData.SetValue(2, 4, 80);

//Sets chart data - Row3
chart.ChartData.SetValue(3, 1, 2011);
chart.ChartData.SetValue(3, 2, 80);
chart.ChartData.SetValue(3, 3, 70);
chart.ChartData.SetValue(3, 4, 60);

//Sets chart data - Row4
chart.ChartData.SetValue(4, 1, 2012);
chart.ChartData.SetValue(4, 2, 60);
chart.ChartData.SetValue(4, 3, 70);
chart.ChartData.SetValue(4, 4, 80);

//Creates a new chart series with the name
IOfficeChartSerie seriesJan = chart.Series.Add("Jan");
//Sets the data range of chart series – start row, start column, end row, end column
seriesJan.Values = chart.ChartData[2, 2, 4, 2];
//Creates a new chart series with the name
IOfficeChartSerie seriesFeb = chart.Series.Add("Feb");
//Sets the data range of chart series – start row, start column, end row, end column
seriesFeb.Values = chart.ChartData[2, 3, 4, 3];
//Creates a new chart series with the name
IOfficeChartSerie seriesMarch = chart.Series.Add("March");
//Sets the data range of chart series – start row, start column, end row, end column
seriesMarch.Values = chart.ChartData[2, 4, 4, 4];
//Sets the data range of the category axis
chart.PrimaryCategoryAxis.CategoryLabels = chart.ChartData[2, 1, 4, 1];
//Specifies the chart type
chart.ChartType = OfficeChartType.Column_Clustered;
//Save the PowerPoint Presentation as stream
FileStream outputStream = new FileStream("Sample.pptx", FileMode.Create);
pptxDoc.Save(outputStream);
//Closes the Presentation
pptxDoc.Close();
//Creates a Presentation instance
IPresentation pptxDoc = Presentation.Create();
//Adds a blank slide to the Presentation
ISlide slide = pptxDoc.Slides.Add(SlideLayoutType.Blank);
//Adds chart to the slide with position and size
IPresentationChart chart = slide.Charts.AddChart(100, 10, 700, 500);
//Specifies the chart title
chart.ChartTitle = "Sales Analysis";
//Sets chart data - Row1
chart.ChartData.SetValue(1, 2, "Jan");
chart.ChartData.SetValue(1, 3, "Feb");
chart.ChartData.SetValue(1, 4, "March");
//Sets chart data - Row2
chart.ChartData.SetValue(2, 1, 2010);
chart.ChartData.SetValue(2, 2, 60);
chart.ChartData.SetValue(2, 3, 70);
chart.ChartData.SetValue(2, 4, 80);
//Sets chart data - Row3
chart.ChartData.SetValue(3, 1, 2011);
chart.ChartData.SetValue(3, 2, 80);
chart.ChartData.SetValue(3, 3, 70);
chart.ChartData.SetValue(3, 4, 60);
//Sets chart data - Row4
chart.ChartData.SetValue(4, 1, 2012);
chart.ChartData.SetValue(4, 2, 60);
chart.ChartData.SetValue(4, 3, 70);
chart.ChartData.SetValue(4, 4, 80);
//Creates a new chart series with the name
IOfficeChartSerie seriesJan = chart.Series.Add("Jan");
//Sets the data range of chart series – start row, start column, end row, end column
seriesJan.Values = chart.ChartData[2, 2, 4, 2];
//Creates a new chart series with the name
IOfficeChartSerie seriesFeb = chart.Series.Add("Feb");
//Sets the data range of chart series – start row, start column, end row, end column
seriesFeb.Values = chart.ChartData[2, 3, 4, 3];
//Creates a new chart series with the name
IOfficeChartSerie seriesMarch = chart.Series.Add("March");
//Sets the data range of chart series – start row, start column, end row, end column
seriesMarch.Values = chart.ChartData[2, 4, 4, 4];
//Sets the data range of the category axis
chart.PrimaryCategoryAxis.CategoryLabels = chart.ChartData[2, 1, 4, 1];
//Specifies the chart type
chart.ChartType = OfficeChartType.Column_Clustered;
//Adds the third slide into the Presentation
pptxDoc.Save("sample.pptx");
//Closes the Presentation
pptxDoc.Close();'Creates a Presentation instance
Dim pptxDoc As IPresentation = Presentation.Create()
'Adds a blank slide to the Presentation
Dim slide As ISlide = pptxDoc.Slides.Add(SlideLayoutType.Blank)
'Adds chart to the slide with position and size
Dim chart As IPresentationChart = slide.Charts.AddChart(100, 10, 700, 500)
'Specifies the chart title
chart.ChartTitle = "Sales Analysis"
'Sets chart data - Row1
chart.ChartData.SetValue(1, 2, "Jan")
chart.ChartData.SetValue(1, 3, "Feb")
chart.ChartData.SetValue(1, 4, "March")
'Sets chart data - Row2
chart.ChartData.SetValue(2, 1, 2010)
chart.ChartData.SetValue(2, 2, 60)
chart.ChartData.SetValue(2, 3, 70)
chart.ChartData.SetValue(2, 4, 80)
'Sets chart data - Row3
chart.ChartData.SetValue(3, 1, 2011)
chart.ChartData.SetValue(3, 2, 80)
chart.ChartData.SetValue(3, 3, 70)
chart.ChartData.SetValue(3, 4, 60)
'Sets chart data - Row4
chart.ChartData.SetValue(4, 1, 2012)
chart.ChartData.SetValue(4, 2, 60)
chart.ChartData.SetValue(4, 3, 70)
chart.ChartData.SetValue(4, 4, 80)
'Creates a new chart series with the name
Dim seriesJan As IOfficeChartSerie = chart.Series.Add("Jan")
'Sets the data range of chart series – start row, start column, end row, end column
seriesJan.Values = chart.ChartData(2, 2, 4, 2)
'Creates a new chart series with the name
Dim seriesFeb As IOfficeChartSerie = chart.Series.Add("Feb")
'Sets the data range of chart series – start row, start column, end row, end column
seriesFeb.Values = chart.ChartData(2, 3, 4, 3)
'Creates a new chart series with the name
Dim seriesMarch As IOfficeChartSerie = chart.Series.Add("March")
'Sets the data range of chart series – start row, start column, end row, end column
seriesMarch.Values = chart.ChartData(2, 4, 4, 4)
'Sets the data range of the category axis
chart.PrimaryCategoryAxis.CategoryLabels = chart.ChartData(2, 1, 4, 1)
'Specifies the chart type
chart.ChartType = OfficeChartType.Column_Clustered
'Adds the third slide into the Presentation
pptxDoc.Save("sample.pptx")
'Closes the Presentation
pptxDoc.Close()You can download a complete working sample from GitHub.
Creating charts from excel sheet
You can also create a chart with the data from an existing excel worksheet. The following code example demonstrates the same.
//Creates a Presentation instance
IPresentation pptxDoc = Presentation.Create();
//Adds a blank slide to the Presentation
ISlide slide = pptxDoc.Slides.Add(SlideLayoutType.Blank);
//Gets the excel file as stream
FileStream excelStream = new FileStream("Book1.xlsx",FileMode.Open);
//Adds a chart to the slide with a data range from excel worksheet – excel workbook, worksheet number, Data range, position, and size.
IPresentationChart chart = slide.Charts.AddChart(excelStream, 1, "A1:D4", new RectangleF(100, 10, 700, 500));
//Save the PowerPoint Presentation as stream
FileStream outputStream = new FileStream("Output.pptx", FileMode.Create);
pptxDoc.Save(outputStream);
//Closes the Presentation
pptxDoc.Close();
//Creates a Presentation instance
IPresentation pptxDoc = Presentation.Create();
//Adds a blank slide to the Presentation
ISlide slide = pptxDoc.Slides.Add(SlideLayoutType.Blank);
//Gets the excel file as stream
MemoryStream excelStream = new MemoryStream(File.ReadAllBytes("Book1.xlsx"));
//Adds a chart to the slide with a data range from excel worksheet – excel workbook, worksheet number, Data range, position, and size.
IPresentationChart chart = slide.Charts.AddChart(excelStream, 1, "A1:D4", new RectangleF(100, 10, 700, 500));
//Saves the Presentation
pptxDoc.Save("output.pptx");
//Closes the Presentation
pptxDoc.Close();'Creates a Presentation instance
Dim pptxDoc As IPresentation = Presentation.Create()
'Adds a blank slide to the Presentation
Dim slide As ISlide = pptxDoc.Slides.Add(SlideLayoutType.Blank)
'Gets the excel file as stream
Dim excelStream As New MemoryStream(File.ReadAllBytes("Book1.xlsx"))
'Adds a chart to the slide with a data range from excel worksheet – excel workbook, worksheet number, Data range, position, and size.
Dim chart As IPresentationChart = slide.Charts.AddChart(excelStream, 1, "A1:D4", New RectangleF(100, 10, 700, 500))
'Saves the Presentation
pptxDoc.Save("output.pptx")
'Closes the Presentation
pptxDoc.Close()You can download a complete working sample from GitHub.
Creating Custom Charts
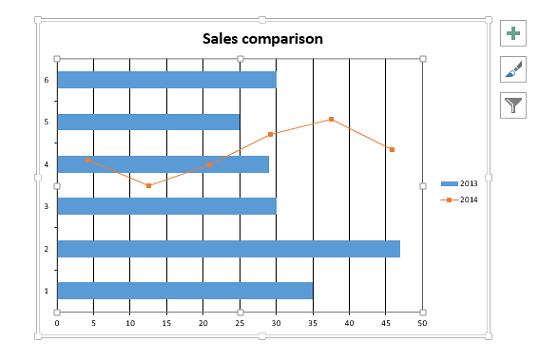
Essential® Presentation facilitates you to create custom charts by adding different charts series for a single chart.
For example, you can use a Bar-clustered chart for the first data series and a scatter-line-marker chart for the second series. As a result, you can have a Bar-clustered chart combined with a scatter-line-marker chart.
The following code example demonstrates how to create custom charts.
//Creates an instance of the IPresentation
IPresentation pptxDoc = Presentation.Create();
//Creates a new slide
ISlide slide = pptxDoc.Slides.Add(SlideLayoutType.Blank);
//Adds a new chart in the slide by specifying its position and size as parameters.
IPresentationChart chart = slide.Charts.AddChart(100, 80, 500, 350);
chart.ChartTitle = "Sales comparison";
chart.ChartTitleArea.Bold = true;

//Sets the data for chart– RowIndex, columnIndex and data
chart.ChartData.SetValue(1, 1, "Month");
chart.ChartData.SetValue(2, 1, "July");
chart.ChartData.SetValue(3, 1, "August");
chart.ChartData.SetValue(4, 1, "September");
chart.ChartData.SetValue(5, 1, "October");
chart.ChartData.SetValue(6, 1, "November");
chart.ChartData.SetValue(7, 1, "December");

chart.ChartData.SetValue(1, 2, "2013");
chart.ChartData.SetValue(2, 2, 35);
chart.ChartData.SetValue(3, 2, 47);
chart.ChartData.SetValue(4, 2, 30);
chart.ChartData.SetValue(5, 2, 29);
chart.ChartData.SetValue(6, 2, 25);
chart.ChartData.SetValue(7, 2, 30);

chart.ChartData.SetValue(1, 3, "2014");
chart.ChartData.SetValue(2, 3, 30);
chart.ChartData.SetValue(3, 3, 25);
chart.ChartData.SetValue(4, 3, 29);
chart.ChartData.SetValue(5, 3, 35);
chart.ChartData.SetValue(6, 3, 38);
chart.ChartData.SetValue(7, 3, 32);

chart.ChartData.SetValue(1, 4, "2015");
chart.ChartData.SetValue(2, 4, 35);
chart.ChartData.SetValue(3, 4, 37);
chart.ChartData.SetValue(4, 4, 30);
chart.ChartData.SetValue(5, 4, 29);
chart.ChartData.SetValue(6, 4, 25);
chart.ChartData.SetValue(7, 4, 30);

//Creates a new ChartSerie with the name
IOfficeChartSerie serie2013 = chart.Series.Add("2013");
//Sets the data range of chart series start row, start column, end row, end column
serie2013.Values = chart.ChartData[2, 2, 7, 2];
serie2013.SerieType = OfficeChartType.Bar_Clustered;
IOfficeChartSerie serie2014 = chart.Series.Add("2014");
serie2014.Values = chart.ChartData[2, 3, 7, 3];
serie2014.SerieType = OfficeChartType.Scatter_Line_Markers;

//Save the PowerPoint Presentation as stream
FileStream outputStream = new FileStream("Output_1.pptx", FileMode.Create);
pptxDoc.Save(outputStream);
//Closes the Presentation
pptxDoc.Close();
//Creates an instance of the IPresentation
IPresentation pptxDoc = Presentation.Create();
//Creates a new slide
ISlide slide = pptxDoc.Slides.Add(SlideLayoutType.Blank);
//Adds a new chart in the slide by specifying its position and size as parameters.
IPresentationChart chart = slide.Charts.AddChart(100, 80, 500, 350);
chart.ChartTitle = "Sales comparison";
chart.ChartTitleArea.Bold = true;
//Sets the data for chart– RowIndex, columnIndex and data
chart.ChartData.SetValue(1, 1, "Month");
chart.ChartData.SetValue(2, 1, "July");
chart.ChartData.SetValue(3, 1, "August");
chart.ChartData.SetValue(4, 1, "September");
chart.ChartData.SetValue(5, 1, "October");
chart.ChartData.SetValue(6, 1, "November");
chart.ChartData.SetValue(7, 1, "December");
chart.ChartData.SetValue(1, 2, "2013");
chart.ChartData.SetValue(2, 2, 35);
chart.ChartData.SetValue(3, 2, 47);
chart.ChartData.SetValue(4, 2, 30);
chart.ChartData.SetValue(5, 2, 29);
chart.ChartData.SetValue(6, 2, 25);
chart.ChartData.SetValue(7, 2, 30);
chart.ChartData.SetValue(1, 3, "2014");
chart.ChartData.SetValue(2, 3, 30);
chart.ChartData.SetValue(3, 3, 25);
chart.ChartData.SetValue(4, 3, 29);
chart.ChartData.SetValue(5, 3, 35);
chart.ChartData.SetValue(6, 3, 38);
chart.ChartData.SetValue(7, 3, 32);
chart.ChartData.SetValue(1, 4, "2015");
chart.ChartData.SetValue(2, 4, 35);
chart.ChartData.SetValue(3, 4, 37);
chart.ChartData.SetValue(4, 4, 30);
chart.ChartData.SetValue(5, 4, 29);
chart.ChartData.SetValue(6, 4, 25);
chart.ChartData.SetValue(7, 4, 30);
//Creates a new ChartSerie with the name
IOfficeChartSerie serie2013 = chart.Series.Add("2013");
//Sets the data range of chart series start row, start column, end row, end column
serie2013.Values = chart.ChartData[2, 2, 7, 2];
serie2013.SerieType = OfficeChartType.Bar_Clustered;
IOfficeChartSerie serie2014 = chart.Series.Add("2014");
serie2014.Values = chart.ChartData[2, 3, 7, 3];
serie2014.SerieType = OfficeChartType.Scatter_Line_Markers;
//Saves the Presentation
pptxDoc.Save("Output_1.pptx");
//Closes the Presentation
pptxDoc.Close();'Creates an instance of the IPresentation
Dim pptxDoc As IPresentation = Presentation.Create()
'Creates a new slide
Dim slide As ISlide = pptxDoc.Slides.Add(SlideLayoutType.Blank)
'Adds a new chart in the slide by specifying its position and size as parameters.
Dim chart As IPresentationChart = slide.Charts.AddChart(100, 80, 500, 350)
chart.ChartTitle = "Sales comparison"
chart.ChartTitleArea.Bold = True
'Sets the data for chart– RowIndex, columnIndex, and data
chart.ChartData.SetValue(1, 1, "Month")
chart.ChartData.SetValue(2, 1, "July")
chart.ChartData.SetValue(3, 1, "August")
chart.ChartData.SetValue(4, 1, "September")
chart.ChartData.SetValue(5, 1, "October")
chart.ChartData.SetValue(6, 1, "November")
chart.ChartData.SetValue(7, 1, "December")
chart.ChartData.SetValue(1, 2, "2013")
chart.ChartData.SetValue(2, 2, 35)
chart.ChartData.SetValue(3, 2, 47)
chart.ChartData.SetValue(4, 2, 30)
chart.ChartData.SetValue(5, 2, 29)
chart.ChartData.SetValue(6, 2, 25)
chart.ChartData.SetValue(7, 2, 30)
chart.ChartData.SetValue(1, 3, "2014")
chart.ChartData.SetValue(2, 3, 30)
chart.ChartData.SetValue(3, 3, 25)
chart.ChartData.SetValue(4, 3, 29)
chart.ChartData.SetValue(5, 3, 35)
chart.ChartData.SetValue(6, 3, 38)
chart.ChartData.SetValue(7, 3, 32)
chart.ChartData.SetValue(1, 4, "2015")
chart.ChartData.SetValue(2, 4, 35)
chart.ChartData.SetValue(3, 4, 37)
chart.ChartData.SetValue(4, 4, 30)
chart.ChartData.SetValue(5, 4, 29)
chart.ChartData.SetValue(6, 4, 25)
chart.ChartData.SetValue(7, 4, 30)
'Creates a new ChartSerie with the name
Dim serie2013 As IOfficeChartSerie = chart.Series.Add("2013")
'Sets the data range of chart series start row, start column, end row, end column
serie2013.Values = chart.ChartData(2, 2, 7, 2)
serie2013.SerieType = OfficeChartType.Bar_Clustered
Dim serie2014 As IOfficeChartSerie = chart.Series.Add("2014")
serie2014.Values = chart.ChartData(2, 3, 7, 3)
serie2014.SerieType = OfficeChartType.Scatter_Line_Markers
'Saves the Presentation
pptxDoc.Save("Output_1.pptx")
'Closes the Presentation
pptxDoc.Close()You can download a complete working sample from GitHub.
The above code example creates a chart in the following screenshot.
Refreshing the chart
Sometimes, the charts do not represent the actual data. In those cases, the charts in PowerPoint Presentation should be refreshed.
The following code example demonstrates how to refresh the charts in PowerPoint Presentation.
//Loads or open an PowerPoint Presentation
FileStream inputStream = new FileStream("Sample.pptx",FileMode.Open);
IPresentation pptxDoc = Presentation.Open(inputStream);
//Gets the first slide
ISlide slide = pptxDoc.Slides[0];
//Gets the chart in slide
IPresentationChart chart = slide.Shapes[0] as IPresentationChart;
//Refreshes the chart data. Set true to evaluate Excel formulas before refreshing,
//or false to refresh only the data without evaluating formulas.
chart.Refresh(false);
//Save the PowerPoint Presentation as stream
FileStream outputStream = new FileStream("Output.pptx", FileMode.Create);
pptxDoc.Save(outputStream);
//Closes the Presentation
pptxDoc.Close();
//Opens the Presentation
IPresentation pptxDoc = Presentation.Open("Chart.pptx");
//Gets the first slide
ISlide slide = pptxDoc.Slides[0];
//Gets the chart in slide
IPresentationChart chart = slide.Shapes[0] as IPresentationChart;
//Refreshes the chart data. Set true to evaluate Excel formulas before refreshing,
//or false to refresh only the data without evaluating formulas.
chart.Refresh(false);
//Saves the Presentation
pptxDoc.Save("output.pptx");
//Closes the Presentation
pptxDoc.Close();'Opens the Presentation
Dim pptxDoc As IPresentation = Presentation.Open("Chart.pptx")
'Gets the first slide
Dim slide As ISlide = pptxDoc.Slides(0)
'Gets the chart in slide
Dim chart As IPresentationChart = TryCast(slide.Shapes(0), IPresentationChart)
'Refreshes the chart data. Set true to evaluate Excel formulas before refreshing,
'or false to refresh only the data without evaluating formulas.
chart.Refresh(false)
'Saves the Presentation
pptxDoc.Save("output.pptx")
'Closes the Presentation
pptxDoc.Close()You can download a complete working sample from GitHub.
Editing the Chart Data
You can change the data for an existing chart. The code example demonstrates how to modify the chart in a slide.
//Loads or open an PowerPoint Presentation
FileStream inputStream = new FileStream("Sample.pptx",FileMode.Open);
IPresentation pptxDoc = Presentation.Open(inputStream);
//Gets the first slide
ISlide slide = pptxDoc.Slides[0];
//Gets the chart in slide
IPresentationChart chart = slide.Shapes[0] as IPresentationChart;

//Modifies chart data - Row1
chart.ChartData.SetValue(1, 2, "Jan");
chart.ChartData.SetValue(1, 3, "Feb");
chart.ChartData.SetValue(1, 4, "March");

//Modifies chart data - Row2
chart.ChartData.SetValue(2, 1, 2010);
chart.ChartData.SetValue(2, 2, 60);
chart.ChartData.SetValue(2, 3, 70);
chart.ChartData.SetValue(2, 4, 80);

//Refreshes the chart
chart.Refresh();
//Save the PowerPoint Presentation as stream
FileStream outputStream = new FileStream("Output.pptx", FileMode.Create);
pptxDoc.Save(outputStream);
//Closes the Presentation
pptxDoc.Close();
//Opens a Presentation
IPresentation pptxDoc = Presentation.Open("Sample.pptx");
//Adds a slide to the Presentation
ISlide slide = pptxDoc.Slides[0];
//Gets the chart in slide
IPresentationChart chart = slide.Shapes[0] as IPresentationChart;
//Modifies chart data - Row1
chart.ChartData.SetValue(1, 2, "Jan");
chart.ChartData.SetValue(1, 3, "Feb");
chart.ChartData.SetValue(1, 4, "March");
//Modifies chart data - Row2
chart.ChartData.SetValue(2, 1, 2010);
chart.ChartData.SetValue(2, 2, 60);
chart.ChartData.SetValue(2, 3, 70);
chart.ChartData.SetValue(2, 4, 80);
//Refreshes the chart
chart.Refresh();
//Saves the Presentation
pptxDoc.Save("output.pptx");
//Closes the Presentation
pptxDoc.Close();'Opens a Presentation
Dim pptxDoc As IPresentation = Presentation.Open("Sample.pptx")
'Adds a slide to the Presentation
Dim slide As ISlide = pptxDoc.Slides(0)
'Gets the chart in slide
Dim chart As IPresentationChart = TryCast(slide.Shapes(0), IPresentationChart)
'Modifies chart data - Row1
chart.ChartData.SetValue(1, 2, "Jan")
chart.ChartData.SetValue(1, 3, "Feb")
chart.ChartData.SetValue(1, 4, "March")
'Modifies chart data - Row2
chart.ChartData.SetValue(2, 1, 2010)
chart.ChartData.SetValue(2, 2, 60)
chart.ChartData.SetValue(2, 3, 70)
chart.ChartData.SetValue(2, 4, 80)
'Refreshes the chart
chart.Refresh()
'Saves the Presentation
pptxDoc.Save("output.pptx")
'Closes the Presentation
pptxDoc.Close()You can download a complete working sample from GitHub.
Customizing the chart
A chart is composed of various elements such as legends, axes, series, etc. Each chart element corresponds to an object. The following image illustrates the basic elements of a chart.
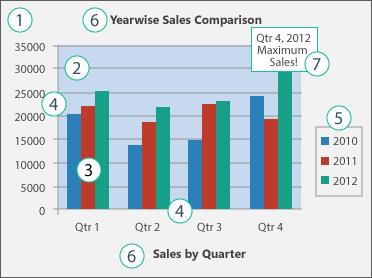
- The chart area of the chart.
- The plot area of the chart.
- The data points of the data series that are plotted in the chart.
- The horizontal (category) and vertical (value) axis along where the data is plotted in the chart.
- The legend of the chart.
- A chart and axis title that you can use in the chart.
- A data label that you can use to identify the details of a data point in a data series.
Chart Title
Customize the chart title by modifying its name, appearance, and resizing it using the Presentation library. For more information, click here.
Chart Area
Customize the chart area by changing its border, colors, transparency, and more using the Presentation library. For further information, click here.
Chart Plot Area
Customize the chart plot area by changing its border, colors, transparency, position and adding image using the Presentation library. For further information, click here.
Chart Series
Customize the chart series by changing the series name, type, color, border, and more using the Presentation library. For further information, click here.
Chart Legend
Customize the chart legend by changing the position, border, and modifying the legend entry using the Presentation library. For further information, click here.
Chart Data Labels
Customize the chart data labels by changing the position, size and more using the Presentation library. For further information, click here.
Chart Axis
Customize the chart axes by changing the title, border, font, rotation angle and more using the Presentation library. For further information, click here.
Applying 3D Formats
Essential® Presentation allows you to modify side wall, back wall, and floor settings of a 3-D chart. The following code example explains how to apply these settings to a 3-D chart.
//Loads or open an PowerPoint Presentation
FileStream inputStream = new FileStream("Sample.pptx",FileMode.Open);
IPresentation pptxDoc = Presentation.Open(inputStream);
//Gets the first slide
ISlide slide = pptxDoc.Slides[0];
//Gets the chart in slide
IPresentationChart chart = slide.Shapes[0] as IPresentationChart;
//Changes the chart type to 3D
chart.ChartType = OfficeChartType.Bar_Clustered_3D;
//Sets the rotation
chart.Rotation = 80;
//Sets the shadow angle
chart.SideWall.Shadow.Angle = 60;
//Sets the back wall border weight
chart.BackWall.Border.LineWeight = OfficeChartLineWeight.Narrow;
//Save the PowerPoint Presentation as stream
FileStream outputStream = new FileStream("Output.pptx", FileMode.Create);
//Set the right angle axes property of the chart
chart.RightAngleAxes = true;
//Set the auto scaling of chart
chart.AutoScaling = true;
pptxDoc.Save(outputStream);
//Closes the Presentation
pptxDoc.Close();
//Opens the Presentation
IPresentation pptxDoc = Presentation.Open("Sample.pptx");
//Gets the first slide
ISlide slide = pptxDoc.Slides[0];
//Gets the chart in slide
IPresentationChart chart = slide.Shapes[0] as IPresentationChart;
//Changes the chart type to 3D
chart.ChartType = OfficeChartType.Bar_Clustered_3D;
//Sets the rotation
chart.Rotation = 80;
//Sets the shadow angle
chart.SideWall.Shadow.Angle = 60;
//Sets the back wall border weight
chart.BackWall.Border.LineWeight = OfficeChartLineWeight.Narrow;
//Set the right angle axes property of the chart
chart.RightAngleAxes = true;
//Set the auto scaling of chart
chart.AutoScaling = true;
//Saves the Presentation
pptxDoc.Save("output.pptx");
//Closes the Presentation
pptxDoc.Close();'Opens the Presentation
Dim pptxDoc As IPresentation = Presentation.Open("Sample.pptx")
'Gets the first slide
Dim slide As ISlide = pptxDoc.Slides(0)
'Gets the chart in slide
Dim chart As IPresentationChart = TryCast(slide.Shapes(0), IPresentationChart)
'Changes the chart type to 3D
chart.ChartType = OfficeChartType.Bar_Clustered_3D
'Sets the rotation
chart.Rotation = 80
'Sets the shadow angle
chart.SideWall.Shadow.Angle = 60
'Sets the back wall border weight
chart.BackWall.Border.LineWeight = OfficeChartLineWeight.Narrow
'Set the right angle axes property of the chart
chart.RightAngleAxes = True
'Set the auto scaling of chart
chart.AutoScaling = True
'Saves the Presentation
pptxDoc.Save("output.pptx")
'Closes the Presentation
pptxDoc.Close()You can download a complete working sample from GitHub.
Chart to Image conversion
To convert chart in PowerPoint slide as an image, refer the below dependencies in your application.
| Platform(s) | NuGet for Chart to Image | Assemblies for Chart to image |
|---|---|---|
| Cross-platform, Xamarin | ||
| Windows-specific |
|
|
| UWP |
The following code example demonstrates how to convert the charts in a Presentation slide to image.
TIPS
You can specify the quality of the converted charts by setting the scaling mode. For more details on how to set the scaling mode, see Converting PowerPoint presentation to Images
//Loads or open an PowerPoint Presentation
FileStream inputStream = new FileStream("../../../Data/Sample.pptx", FileMode.Open);
IPresentation pptxDoc = Presentation.Open(inputStream);
//Initialize the PresentationRenderer
pptxDoc.PresentationRenderer = new PresentationRenderer();
//Gets the first instance of chart from slide
IPresentationChart chart = pptxDoc.Slides[0].Charts[0];
//Converts the chart to image.
Stream image = new FileStream("../../../Data/ChartToImage.jpg", FileMode.Create, FileAccess.ReadWrite);
pptxDoc.PresentationRenderer.ConvertToImage(chart, image);
//Closes the presentation
pptxDoc.Close();
image.Close();
inputStream.Close();
//Opens the Presentation
IPresentation pptxDoc = Presentation.Open("Sample.pptx");
//Initializes the ChartToImageConverter class; this is mandatory
pptxDoc.ChartToImageConverter = new ChartToImageConverter();
//Sets the scaling mode for quality
pptxDoc.ChartToImageConverter.ScalingMode = Syncfusion.OfficeChart.ScalingMode.Best;
//Gets the first slide
ISlide slide = pptxDoc.Slides[0];
//Gets the chart in slide
IPresentationChart chart = slide.Shapes[0] as IPresentationChart;
//Creates a stream instance to store the image
MemoryStream stream = new MemoryStream();
//Saves the image to stream
chart.SaveAsImage(stream);
//Saves the stream to a file
using (FileStream fileStream = File.Create("ChartImage.png", (int)stream.Length))
fileStream.Write(stream.ToArray(), 0, stream.ToArray().Length);
//Closes the stream
stream.Close();
//Closes the Presentation
pptxDoc.Close();'Opens the Presentation
Dim pptxDoc As IPresentation = Presentation.Open("Sample.pptx")
'Initializes the ChartToImageConverter class; this is mandatory
pptxDoc.ChartToImageConverter = New ChartToImageConverter()
'Sets the scaling mode for quality
pptxDoc.ChartToImageConverter.ScalingMode = Syncfusion.OfficeChart.ScalingMode.Best
'Gets the first slide
Dim slide As ISlide = pptxDoc.Slides(0)
'Gets the chart in slide
Dim chart As IPresentationChart = TryCast(slide.Shapes(0), IPresentationChart)
'Creates a stream instance to store the image
Dim stream As New MemoryStream()
'Saves the image to stream
chart.SaveAsImage(stream)
'Saves the stream to a file
Using fileStream As FileStream = File.Create("ChartImage.png", CInt(stream.Length))
fileStream.Write(stream.ToArray(), 0, stream.ToArray().Length)
End Using
'Closes the stream
stream.Close()
'Closes the Presentation
pptxDoc.Close()You can download a complete working sample from GitHub.
Removing the chart from slide
The following code example demonstrates removing a chart from a slide.
//Loads or open an PowerPoint Presentation
FileStream inputStream = new FileStream("Sample.pptx",FileMode.Open);
IPresentation pptxDoc = Presentation.Open(inputStream);
//Gets the first slide
ISlide slide = pptxDoc.Slides[0];
//Gets the chart in slide
IPresentationChart chart = slide.Shapes[0] as IPresentationChart;
//Removes the chart from slide
slide.Shapes.Remove(chart as IShape);
//Save the PowerPoint Presentation as stream
FileStream outputStream = new FileStream("Output.pptx", FileMode.Create);
pptxDoc.Save(outputStream);
//Closes the presentation
pptxDoc.Close();
//Opens the Presentation
IPresentation pptxDoc = Presentation.Open("Sample.pptx");
//Gets the first slide
ISlide slide = pptxDoc.Slides[0];
//Gets the chart in slide
IPresentationChart chart = slide.Shapes[0] as IPresentationChart;
//Removes the chart from slide
slide.Shapes.Remove(chart as IShape);
//Saves the Presentation
pptxDoc.Save("output.pptx");
//Closes the presentation
pptxDoc.Close();'Opens the Presentation
Dim pptxDoc As IPresentation = Presentation.Open("Sample.pptx")
'Gets the first slide
Dim slide As ISlide = pptxDoc.Slides(0)
'Gets the chart in slide
Dim chart As IPresentationChart = TryCast(slide.Shapes(0), IPresentationChart)
'Removes the chart from slide
slide.Shapes.Remove(TryCast(chart, IShape))
'Saves the Presentation
pptxDoc.Save("output.pptx")
'Closes the Presentation
pptxDoc.Close()You can download a complete working sample from GitHub.
Creating a Scatter chart
The following code example demonstrates creating a Scatter chart.
//Create an instance for PowerPoint
IPresentation pptxDoc = Presentation.Create();
//Add a blank slide to Presentation
ISlide slide = pptxDoc.Slides.Add(SlideLayoutType.Blank);
//Adds chart to the slide with position and size
IPresentationChart chart = slide.Charts.AddChart(100, 10, 700, 500);
//Set the chart type as Scatter_Markers
chart.ChartType = OfficeChartType.Scatter_Markers;
//Assign data
chart.DataRange = chart.ChartData[1, 1, 4, 2];
chart.IsSeriesInRows = false;
//Set data to the chart RowIndex, columnIndex, and data
chart.ChartData.SetValue(1, 1, "X-Axis");
chart.ChartData.SetValue(1, 2, "Y-Axis");
chart.ChartData.SetValue(2, 1, 1);
chart.ChartData.SetValue(3, 1, 5);
chart.ChartData.SetValue(4, 1, 10);
chart.ChartData.SetValue(2, 2, 10);
chart.ChartData.SetValue(3, 2, 5);
chart.ChartData.SetValue(4, 2, 1);
//Apply chart elements
//Set chart title
chart.ChartTitle = "Scatter Markers Chart";
//Set legend
chart.HasLegend = false;
//Set Datalabels
IOfficeChartSerie serie = chart.Series[0];
serie.DataPoints.DefaultDataPoint.DataLabels.IsValue = true;
serie.DataPoints.DefaultDataPoint.DataLabels.IsCategoryName = true;
//Save the PowerPoint Presentation as stream
FileStream outputStream = new FileStream("Output.pptx", FileMode.Create);
pptxDoc.Save(outputStream);
//Closes the presentation
pptxDoc.Close();
//Create an instance for PowerPoint
IPresentation pptxDoc = Presentation.Create();
//Add a blank slide to Presentation
ISlide slide = pptxDoc.Slides.Add(SlideLayoutType.Blank);
//Adds chart to the slide with position and size
IPresentationChart chart = slide.Charts.AddChart(100, 10, 700, 500);
//Set the chart type as Scatter_Markers
chart.ChartType = OfficeChartType.Scatter_Markers;
//Assign data
chart.DataRange = chart.ChartData[1, 1, 4, 2];
chart.IsSeriesInRows = false;
//Set data to the chart RowIndex, columnIndex, and data
chart.ChartData.SetValue(1, 1, "X-Axis");
chart.ChartData.SetValue(1, 2, "Y-Axis");
chart.ChartData.SetValue(2, 1, 1);
chart.ChartData.SetValue(3, 1, 5);
chart.ChartData.SetValue(4, 1, 10);
chart.ChartData.SetValue(2, 2, 10);
chart.ChartData.SetValue(3, 2, 5);
chart.ChartData.SetValue(4, 2, 1);
//Apply chart elements
//Set chart title
chart.ChartTitle = "Scatter Markers Chart";
//Set legend
chart.HasLegend = false;
//Set Datalabels
IOfficeChartSerie serie = chart.Series[0];
serie.DataPoints.DefaultDataPoint.DataLabels.IsValue = true;
serie.DataPoints.DefaultDataPoint.DataLabels.IsCategoryName = true;
//Saves the Presentation
pptxDoc.Save("output.pptx");
//Closes the presentation
pptxDoc.Close();'Create an instance for PowerPoint
IPresentation pptxDoc = Presentation.Create()
'Add a blank slide to Presentation
ISlide slide = pptxDoc.Slides.Add(SlideLayoutType.Blank)
'Adds chart to the slide with position and size
IPresentationChart chart = slide.Charts.AddChart(100, 10, 700, 500)
'Set the chart type as Scatter_Markers
chart.ChartType = OfficeChartType.Scatter_Markers
'Assign data
chart.DataRange = chart.ChartData[1, 1, 4, 2]
chart.IsSeriesInRows = false
'Set data to the chart RowIndex, columnIndex, and data
chart.ChartData.SetValue(1, 1, "X-Axis")
chart.ChartData.SetValue(1, 2, "Y-Axis")
chart.ChartData.SetValue(2, 1, 1)
chart.ChartData.SetValue(3, 1, 5)
chart.ChartData.SetValue(4, 1, 10)
chart.ChartData.SetValue(2, 2, 10)
chart.ChartData.SetValue(3, 2, 5)
chart.ChartData.SetValue(4, 2, 1)
'Apply chart elements
'Set chart title
chart.ChartTitle = "Scatter Markers Chart"
'Set legend
chart.HasLegend = false
'Set Datalabels
IOfficeChartSerie serie = chart.Series[0]
serie.DataPoints.DefaultDataPoint.DataLabels.IsValue = true
serie.DataPoints.DefaultDataPoint.DataLabels.IsCategoryName = true
'Saves the Presentation
pptxDoc.Save("output.pptx")
'Closes the Presentation
pptxDoc.Close()You can download a complete working sample from GitHub.
PowerPoint 2016 Charts
Essential® Presentation supports creating and manipulating new and modern chart types such as waterfall, histogram, pareto, box and whisker, tree map, and sunburst, which are introduced in Microsoft PowerPoint 2016.
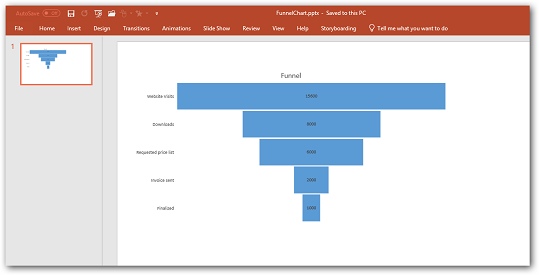
Funnel
Funnel charts show values across multiple stages in a process. Refer to the following code example to create a Funnel chart.
//Creates a new instance of PowerPoint Presentation
IPresentation pptxDoc = Presentation.Create();
//Adds a slide to Presentation
ISlide slide1 = pptxDoc.Slides.Add(SlideLayoutType.Blank);
//Create a chart
IPresentationChart chart = slide1.Charts.AddChart(30, 50, 600, 300);
//Set chart type as Funnel
chart.ChartType = OfficeChartType.Funnel;
//Set the chart title
chart.ChartTitle = "Funnel";
//Assign data
chart.DataRange = chart.ChartData[1, 1, 6, 2];
chart.IsSeriesInRows = false;
//Set data
chart.ChartData.SetValue(1, 1, "Web sales");
chart.ChartData.SetValue(1, 2, "Users count");
chart.ChartData.SetValue(2, 1, "Website Visits");
chart.ChartData.SetValue(2, 2, "15600");
chart.ChartData.SetValue(3, 1, "Downloads");
chart.ChartData.SetValue(3, 2, "8000");
chart.ChartData.SetValue(4, 1, "Requested price list");
chart.ChartData.SetValue(4, 2, "6000");
chart.ChartData.SetValue(5, 1, "Invoice sent");
chart.ChartData.SetValue(5, 2, "2000");
chart.ChartData.SetValue(6, 1, "Finalized");
chart.ChartData.SetValue(6, 2, "1000");
//Formatting the legend and data label option
chart.HasLegend = false;
IOfficeChartSerie serie = chart.Series[0];
chart.Series[0].DataPoints.DefaultDataPoint.DataLabels.IsValue = true;
chart.Series[0].DataPoints.DefaultDataPoint.DataLabels.Size = 8;
//Save and close the presentation
pptxDoc.Save("FunnelChart.pptx");
pptxDoc.Close();
using (IPresentation pptxDoc = Presentation.Create())
{
ISlide slide1 = pptxDoc.Slides.Add(SlideLayoutType.Blank);
//Create a chart
IPresentationChart chart = slide1.Charts.AddChart(30, 50, 600, 300);
//Set chart type as Funnel
chart.ChartType = OfficeChartType.Funnel;
//Set the chart title
chart.ChartTitle = "Funnel";
//Assign data
chart.DataRange = chart.ChartData[1, 1, 6, 2];
chart.IsSeriesInRows = false;
//Set data
chart.ChartData.SetValue(1, 1, "Web sales");
chart.ChartData.SetValue(1, 2, "Users count");
chart.ChartData.SetValue(2, 1, "Website Visits");
chart.ChartData.SetValue(2, 2, "15600");
chart.ChartData.SetValue(3, 1, "Downloads");
chart.ChartData.SetValue(3, 2, "8000");
chart.ChartData.SetValue(4, 1, "Requested price list");
chart.ChartData.SetValue(4, 2, "6000");
chart.ChartData.SetValue(5, 1, "Invoice sent");
chart.ChartData.SetValue(5, 2, "2000");
chart.ChartData.SetValue(6, 1, "Finalized");
chart.ChartData.SetValue(6, 2, "1000");
//Formatting the legend and data label option
chart.HasLegend = false;
IOfficeChartSerie serie = chart.Series[0];
chart.Series[0].DataPoints.DefaultDataPoint.DataLabels.IsValue = true;
chart.Series[0].DataPoints.DefaultDataPoint.DataLabels.Size = 8;
//Save and close the presentation
pptxDoc.Save("FunnelChart.pptx");
pptxDoc.Close();
}'Creates a PowerPoint instance
Dim pptxDoc As IPresentation = Presentation.Create()
Dim slide1 As ISlide = pptxDoc.Slides.Add(SlideLayoutType.Blank)
'Create a chart
Dim chart As IPresentationChart = slide1.Charts.AddChart(30, 50, 600, 300)
'Set chart type as Funnel
chart.ChartType = OfficeChartType.Funnel
'Set the chart title
chart.ChartTitle = "Funnel"
'Assign data
chart.DataRange = chart.ChartData(1, 1, 6, 2)
chart.IsSeriesInRows = False
'Set data
chart.ChartData.SetValue(1, 1, "Web sales")
chart.ChartData.SetValue(1, 2, "Users count")
chart.ChartData.SetValue(2, 1, "Website Visits")
chart.ChartData.SetValue(2, 2, "15600")
chart.ChartData.SetValue(3, 1, "Downloads")
chart.ChartData.SetValue(3, 2, "8000")
chart.ChartData.SetValue(4, 1, "Requested price list")
chart.ChartData.SetValue(4, 2, "6000")
chart.ChartData.SetValue(5, 1, "Invoice sent")
chart.ChartData.SetValue(5, 2, "2000")
chart.ChartData.SetValue(6, 1, "Finalized")
chart.ChartData.SetValue(6, 2, "1000")
'Formatting the legend and data label option
chart.HasLegend = False
Dim serie As IOfficeChartSerie = chart.Series(0)
chart.Series(0).DataPoints.DefaultDataPoint.DataLabels.IsValue = True
chart.Series(0).DataPoints.DefaultDataPoint.DataLabels.Size = 8
'Save and close the presentation
pptxDoc.Save("FunnelChart.pptx")
pptxDoc.Close()You can download a complete working sample from GitHub.
The following screenshot shows the output of previous code.
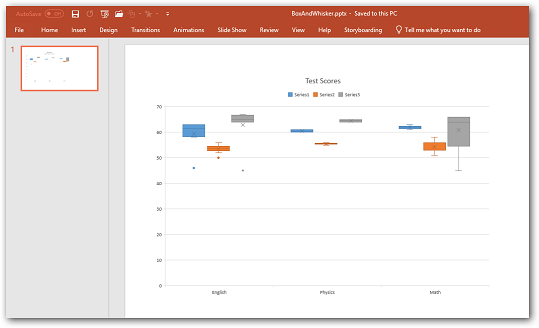
Box and Whisker
Box and Whisker chart shows distribution of data into quartiles, highlighting the mean and outliers. Box and Whisker charts are most commonly used in statistical analysis. Refer to the following code example to create the Box and Whisker chart.
private static void TestBox_Whisker()
{
    using(IPresentation pptxDoc = Presentation.Create())
    {
        ISlide slide1 = pptxDoc.Slides.Add(SlideLayoutType.Blank);
        IPresentationChart chart = slide1.Charts.AddChart(50, 50, 600, 400);
        chart.ChartTitle = "Test Scores";
        chart.ChartType = OfficeChartType.BoxAndWhisker;
        //Assign data
        chart.DataRange = chart.ChartData[1,1,16,4];
        chart.IsSeriesInRows = false;
        //Set data to the chart RowIndex, columnIndex, and data
        SetChartData(chart);

        //Box and Whisker settings on first series
        IOfficeChartSerie seriesA = chart.Series[0];
        seriesA.SerieFormat.ShowInnerPoints = false;
        seriesA.SerieFormat.ShowOutlierPoints = true;
        seriesA.SerieFormat.ShowMeanMarkers = true;
        seriesA.SerieFormat.ShowMeanLine = false;
        seriesA.SerieFormat.QuartileCalculationType = QuartileCalculation.ExclusiveMedian;

        //Box and Whisker settings on second series
        IOfficeChartSerie seriesB = chart.Series[1];
        seriesB.SerieFormat.ShowInnerPoints = false;
        seriesB.SerieFormat.ShowOutlierPoints = true;
        seriesB.SerieFormat.ShowMeanMarkers = true;
        seriesB.SerieFormat.ShowMeanLine = false;
        seriesB.SerieFormat.QuartileCalculationType = QuartileCalculation.InclusiveMedian;

        //Box and Whisker settings on third series
        IOfficeChartSerie seriesC = chart.Series[2];
        seriesC.SerieFormat.ShowInnerPoints = false;
        seriesC.SerieFormat.ShowOutlierPoints = true;
        seriesC.SerieFormat.ShowMeanMarkers = true;
        seriesC.SerieFormat.ShowMeanLine = false;
        seriesC.SerieFormat.QuartileCalculationType = QuartileCalculation.ExclusiveMedian;

        //Save and close the presentation
        pptxDoc.Save("BoxAndWhisker.pptx");
        pptxDoc.Close();
    }
}
/// <summary>
/// Set the values for the chart
/// </summary>
/// <param name="chart">Represent the instance of the Presentation chart</param>
private static void SetChartData(IPresentationChart chart)
{
    chart.ChartData.SetValue(1, 1, "Course");
    chart.ChartData.SetValue(1, 2, "SchoolA");
    chart.ChartData.SetValue(1, 3, "SchoolB");
    chart.ChartData.SetValue(1, 4, "SchoolC");

    chart.ChartData.SetValue(2, 1, "English");
    chart.ChartData.SetValue(2, 2, 63);
    chart.ChartData.SetValue(2, 3, 53);
    chart.ChartData.SetValue(2, 4, 45);

    chart.ChartData.SetValue(3, 1, "Physics");
    chart.ChartData.SetValue(3, 2, 61);
    chart.ChartData.SetValue(3, 3, 55);
    chart.ChartData.SetValue(3, 4, 65);

    chart.ChartData.SetValue(4, 1, "English");
    chart.ChartData.SetValue(4, 2, 63);
    chart.ChartData.SetValue(4, 3, 50);
    chart.ChartData.SetValue(4, 4, 65);

    chart.ChartData.SetValue(5, 1, "Math");
    chart.ChartData.SetValue(5, 2, 62);
    chart.ChartData.SetValue(5, 3, 51);
    chart.ChartData.SetValue(5, 4, 64);

    chart.ChartData.SetValue(6, 1, "English");
    chart.ChartData.SetValue(6, 2, 46);
    chart.ChartData.SetValue(6, 3, 53);
    chart.ChartData.SetValue(6, 4, 66);

    chart.ChartData.SetValue(7, 1, "English");
    chart.ChartData.SetValue(7, 2, 58);
    chart.ChartData.SetValue(7, 3, 56);
    chart.ChartData.SetValue(7, 4, 67);

    chart.ChartData.SetValue(8, 1, "Math");
    chart.ChartData.SetValue(8, 2, 62);
    chart.ChartData.SetValue(8, 3, 53);
    chart.ChartData.SetValue(8, 4, 66);

    chart.ChartData.SetValue(9, 1, "Math");
    chart.ChartData.SetValue(9, 2, 62);
    chart.ChartData.SetValue(9, 3, 53);
    chart.ChartData.SetValue(9, 4, 66);

    chart.ChartData.SetValue(10, 1, "English");
    chart.ChartData.SetValue(10, 2, 63);
    chart.ChartData.SetValue(10, 3, 54);
    chart.ChartData.SetValue(10, 4, 64);

    chart.ChartData.SetValue(11, 1, "English");
    chart.ChartData.SetValue(11, 2, 63);
    chart.ChartData.SetValue(11, 3, 52);
    chart.ChartData.SetValue(11, 4, 67);

    chart.ChartData.SetValue(12, 1, "Physics");
    chart.ChartData.SetValue(12, 2, 60);
    chart.ChartData.SetValue(12, 3, 56);
    chart.ChartData.SetValue(12, 4, 64);

    chart.ChartData.SetValue(13, 1, "English");
    chart.ChartData.SetValue(13, 2, 60);
    chart.ChartData.SetValue(13, 3, 56);
    chart.ChartData.SetValue(13, 4, 64);

    chart.ChartData.SetValue(14, 1, "Math");
    chart.ChartData.SetValue(14, 2, 61);
    chart.ChartData.SetValue(14, 3, 56);
    chart.ChartData.SetValue(14, 4, 45);

    chart.ChartData.SetValue(15, 1, "Math");
    chart.ChartData.SetValue(15, 2, 63);
    chart.ChartData.SetValue(15, 3, 58);
    chart.ChartData.SetValue(15, 4, 64);

    chart.ChartData.SetValue(16, 1, "English");
    chart.ChartData.SetValue(16, 2, 59);
    chart.ChartData.SetValue(16, 3, 54);
    chart.ChartData.SetValue(16, 4, 65);
}
private static void TestBox_Whisker()
{
using(IPresentation pptxDoc = Presentation.Create())
{
ISlide slide1 = pptxDoc.Slides.Add(SlideLayoutType.Blank);
IPresentationChart chart = slide1.Charts.AddChart(50, 50, 600, 400);
chart.ChartTitle = "Test Scores";
chart.ChartType = OfficeChartType.BoxAndWhisker;
//Assign data
chart.DataRange = chart.ChartData[1,1,16,4];
chart.IsSeriesInRows = false;
//Set data to the chart RowIndex, columnIndex, and data
SetChartData(chart);
//Box and Whisker settings on first series
IOfficeChartSerie seriesA = chart.Series[0];
seriesA.SerieFormat.ShowInnerPoints = false;
seriesA.SerieFormat.ShowOutlierPoints = true;
seriesA.SerieFormat.ShowMeanMarkers = true;
seriesA.SerieFormat.ShowMeanLine = false;
seriesA.SerieFormat.QuartileCalculationType = QuartileCalculation.ExclusiveMedian;
//Box and Whisker settings on second series
IOfficeChartSerie seriesB = chart.Series[1];
seriesB.SerieFormat.ShowInnerPoints = false;
seriesB.SerieFormat.ShowOutlierPoints = true;
seriesB.SerieFormat.ShowMeanMarkers = true;
seriesB.SerieFormat.ShowMeanLine = false;
seriesB.SerieFormat.QuartileCalculationType = QuartileCalculation.InclusiveMedian;
//Box and Whisker settings on third series
IOfficeChartSerie seriesC = chart.Series[2];
seriesC.SerieFormat.ShowInnerPoints = false;
seriesC.SerieFormat.ShowOutlierPoints = true;
seriesC.SerieFormat.ShowMeanMarkers = true;
seriesC.SerieFormat.ShowMeanLine = false;
seriesC.SerieFormat.QuartileCalculationType = QuartileCalculation.ExclusiveMedian;
//Save and close the presentation
pptxDoc.Save("BoxAndWhisker.pptx");
pptxDoc.Close();
}
}
/// <summary>
/// Set the values for the chart
/// </summary>
/// <param name="chart">Represent the instance of the Presentation chart</param>
private static void SetChartData(IPresentationChart chart)
{
chart.ChartData.SetValue(1, 1, "Course");
chart.ChartData.SetValue(1, 2, "SchoolA");
chart.ChartData.SetValue(1, 3, "SchoolB");
chart.ChartData.SetValue(1, 4, "SchoolC");
chart.ChartData.SetValue(2, 1, "English");
chart.ChartData.SetValue(2, 2, 63);
chart.ChartData.SetValue(2, 3, 53);
chart.ChartData.SetValue(2, 4, 45);
chart.ChartData.SetValue(3, 1, "Physics");
chart.ChartData.SetValue(3, 2, 61);
chart.ChartData.SetValue(3, 3, 55);
chart.ChartData.SetValue(3, 4, 65);
chart.ChartData.SetValue(4, 1, "English");
chart.ChartData.SetValue(4, 2, 63);
chart.ChartData.SetValue(4, 3, 50);
chart.ChartData.SetValue(4, 4, 65);
chart.ChartData.SetValue(5, 1, "Math");
chart.ChartData.SetValue(5, 2, 62);
chart.ChartData.SetValue(5, 3, 51);
chart.ChartData.SetValue(5, 4, 64);
chart.ChartData.SetValue(6, 1, "English");
chart.ChartData.SetValue(6, 2, 46);
chart.ChartData.SetValue(6, 3, 53);
chart.ChartData.SetValue(6, 4, 66);
chart.ChartData.SetValue(7, 1, "English");
chart.ChartData.SetValue(7, 2, 58);
chart.ChartData.SetValue(7, 3, 56);
chart.ChartData.SetValue(7, 4, 67);
chart.ChartData.SetValue(8, 1, "Math");
chart.ChartData.SetValue(8, 2, 62);
chart.ChartData.SetValue(8, 3, 53);
chart.ChartData.SetValue(8, 4, 66);
chart.ChartData.SetValue(9, 1, "Math");
chart.ChartData.SetValue(9, 2, 62);
chart.ChartData.SetValue(9, 3, 53);
chart.ChartData.SetValue(9, 4, 66);
chart.ChartData.SetValue(10, 1, "English");
chart.ChartData.SetValue(10, 2, 63);
chart.ChartData.SetValue(10, 3, 54);
chart.ChartData.SetValue(10, 4, 64);
chart.ChartData.SetValue(11, 1, "English");
chart.ChartData.SetValue(11, 2, 63);
chart.ChartData.SetValue(11, 3, 52);
chart.ChartData.SetValue(11, 4, 67);
chart.ChartData.SetValue(12, 1, "Physics");
chart.ChartData.SetValue(12, 2, 60);
chart.ChartData.SetValue(12, 3, 56);
chart.ChartData.SetValue(12, 4, 64);
chart.ChartData.SetValue(13, 1, "English");
chart.ChartData.SetValue(13, 2, 60);
chart.ChartData.SetValue(13, 3, 56);
chart.ChartData.SetValue(13, 4, 64);
chart.ChartData.SetValue(14, 1, "Math");
chart.ChartData.SetValue(14, 2, 61);
chart.ChartData.SetValue(14, 3, 56);
chart.ChartData.SetValue(14, 4, 45);
chart.ChartData.SetValue(15, 1, "Math");
chart.ChartData.SetValue(15, 2, 63);
chart.ChartData.SetValue(15, 3, 58);
chart.ChartData.SetValue(15, 4, 64);
chart.ChartData.SetValue(16, 1, "English");
chart.ChartData.SetValue(16, 2, 59);
chart.ChartData.SetValue(16, 3, 54);
chart.ChartData.SetValue(16, 4, 65);
}Sub TestBoxAndWhiskerChart()
'Creates a PowerPoint instance
Dim pptxDoc As IPresentation = Presentation.Create()
Dim slide1 As ISlide = pptxDoc.Slides.Add(SlideLayoutType.Blank)
Dim chart As IPresentationChart = slide1.Charts.AddChart(50, 50, 600, 400)
chart.ChartTitle = "Test Scores"
chart.ChartType = OfficeChartType.BoxAndWhisker
'Assign data
chart.DataRange = chart.ChartData(1, 1, 16, 4)
chart.IsSeriesInRows = False
'Set data to the chart RowIndex, columnIndex, and data
SetChartData(chart)
'Box and Whisker settings on first series
Dim seriesA As IOfficeChartSerie = chart.Series(0)
seriesA.SerieFormat.ShowInnerPoints = False
seriesA.SerieFormat.ShowOutlierPoints = True
seriesA.SerieFormat.ShowMeanMarkers = True
seriesA.SerieFormat.ShowMeanLine = False
seriesA.SerieFormat.QuartileCalculationType = QuartileCalculation.ExclusiveMedian
'Box and Whisker settings on second series
Dim seriesB As IOfficeChartSerie = chart.Series(1)
seriesB.SerieFormat.ShowInnerPoints = False
seriesB.SerieFormat.ShowOutlierPoints = True
seriesB.SerieFormat.ShowMeanMarkers = True
seriesB.SerieFormat.ShowMeanLine = False
seriesB.SerieFormat.QuartileCalculationType = QuartileCalculation.InclusiveMedian
'Box and Whisker settings on third series
Dim seriesC As IOfficeChartSerie = chart.Series(2)
seriesC.SerieFormat.ShowInnerPoints = False
seriesC.SerieFormat.ShowOutlierPoints = True
seriesC.SerieFormat.ShowMeanMarkers = True
seriesC.SerieFormat.ShowMeanLine = False
seriesC.SerieFormat.QuartileCalculationType = QuartileCalculation.ExclusiveMedian
'Save and close the presentation
pptxDoc.Save("BoxAndWhisker.pptx")
pptxDoc.Close()
End Sub
''' <summary>
''' Set the values for the chart
''' </summary>
''' <param name="chart">Represent the instance of the Presentation chart</param>
Private Sub SetChartData(chart As IPresentationChart)
chart.ChartData.SetValue(1, 1, "Course")
chart.ChartData.SetValue(1, 2, "SchoolA")
chart.ChartData.SetValue(1, 3, "SchoolB")
chart.ChartData.SetValue(1, 4, "SchoolC")
chart.ChartData.SetValue(2, 1, "English")
chart.ChartData.SetValue(2, 2, 63)
chart.ChartData.SetValue(2, 3, 53)
chart.ChartData.SetValue(2, 4, 45)
chart.ChartData.SetValue(3, 1, "Physics")
chart.ChartData.SetValue(3, 2, 61)
chart.ChartData.SetValue(3, 3, 55)
chart.ChartData.SetValue(3, 4, 65)
chart.ChartData.SetValue(4, 1, "English")
chart.ChartData.SetValue(4, 2, 63)
chart.ChartData.SetValue(4, 3, 50)
chart.ChartData.SetValue(4, 4, 65)
chart.ChartData.SetValue(5, 1, "Math")
chart.ChartData.SetValue(5, 2, 62)
chart.ChartData.SetValue(5, 3, 51)
chart.ChartData.SetValue(5, 4, 64)
chart.ChartData.SetValue(6, 1, "English")
chart.ChartData.SetValue(6, 2, 46)
chart.ChartData.SetValue(6, 3, 53)
chart.ChartData.SetValue(6, 4, 66)
chart.ChartData.SetValue(7, 1, "English")
chart.ChartData.SetValue(7, 2, 58)
chart.ChartData.SetValue(7, 3, 56)
chart.ChartData.SetValue(7, 4, 67)
chart.ChartData.SetValue(8, 1, "Math")
chart.ChartData.SetValue(8, 2, 62)
chart.ChartData.SetValue(8, 3, 53)
chart.ChartData.SetValue(8, 4, 66)
chart.ChartData.SetValue(9, 1, "Math")
chart.ChartData.SetValue(9, 2, 62)
chart.ChartData.SetValue(9, 3, 53)
chart.ChartData.SetValue(9, 4, 66)
chart.ChartData.SetValue(10, 1, "English")
chart.ChartData.SetValue(10, 2, 63)
chart.ChartData.SetValue(10, 3, 54)
chart.ChartData.SetValue(10, 4, 64)
chart.ChartData.SetValue(11, 1, "English")
chart.ChartData.SetValue(11, 2, 63)
chart.ChartData.SetValue(11, 3, 52)
chart.ChartData.SetValue(11, 4, 67)
chart.ChartData.SetValue(12, 1, "Physics")
chart.ChartData.SetValue(12, 2, 60)
chart.ChartData.SetValue(12, 3, 56)
chart.ChartData.SetValue(12, 4, 64)
chart.ChartData.SetValue(13, 1, "English")
chart.ChartData.SetValue(13, 2, 60)
chart.ChartData.SetValue(13, 3, 56)
chart.ChartData.SetValue(13, 4, 64)
chart.ChartData.SetValue(14, 1, "Math")
chart.ChartData.SetValue(14, 2, 61)
chart.ChartData.SetValue(14, 3, 56)
chart.ChartData.SetValue(14, 4, 45)
chart.ChartData.SetValue(15, 1, "Math")
chart.ChartData.SetValue(15, 2, 63)
chart.ChartData.SetValue(15, 3, 58)
chart.ChartData.SetValue(15, 4, 64)
chart.ChartData.SetValue(16, 1, "English")
chart.ChartData.SetValue(16, 2, 59)
chart.ChartData.SetValue(16, 3, 54)
chart.ChartData.SetValue(16, 4, 65)
End SubYou can download a complete working sample from GitHub.
The following screenshot shows the output of previous code.
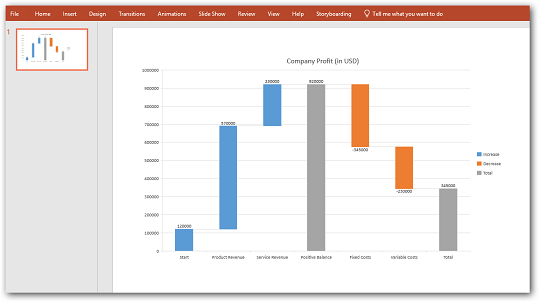
Waterfall
Waterfall chart helps understand the finances of business owners by viewing profit and loss statements. You can quickly illustrate the line items in your financial data and get a clear picture of how each item is impacting your bottom line using a Waterfall chart. Refer to the following code to create a Waterfall chart.
using(IPresentation pptxDoc = Presentation.Create())
{
    ISlide slide1 = pptxDoc.Slides.Add(SlideLayoutType.Blank);
    //Create a chart
    IPresentationChart chart = slide1.Charts.AddChart(50, 50, 700, 400);
    //Set chart type as Waterfall
    chart.ChartType = OfficeChartType.WaterFall;

    //Set data range
    chart.DataRange = chart.ChartData[1, 1, 8, 2];
    chart.IsSeriesInRows = false;
    chart.ChartData.SetValue(2, 1, "Start");
    chart.ChartData.SetValue(2, 2, 120000);
    chart.ChartData.SetValue(3, 1, "Product Revenue");
    chart.ChartData.SetValue(3, 2, 570000);
    chart.ChartData.SetValue(4, 1, "Service Revenue");
    chart.ChartData.SetValue(4, 2, 230000);
    chart.ChartData.SetValue(5, 1, "Positive Balance");
    chart.ChartData.SetValue(5, 2, 920000);
    chart.ChartData.SetValue(6, 1, "Fixed Costs");
    chart.ChartData.SetValue(6, 2, -345000);
    chart.ChartData.SetValue(7, 1, "Variable Costs");
    chart.ChartData.SetValue(7, 2, -230000);
    chart.ChartData.SetValue(8, 1, "Total");
    chart.ChartData.SetValue(8, 2, 345000);

    //Data point settings as total in chart
    IOfficeChartSerie series = chart.Series[0];
    chart.Series[0].DataPoints[3].SetAsTotal = true;
    chart.Series[0].DataPoints[6].SetAsTotal = true;
    //Showing the connector lines between data points
    chart.Series[0].SerieFormat.ShowConnectorLines = true;
    //Set the chart title
    chart.ChartTitle = "Company Profit (in USD)";
    //Formatting data label and legend option
    chart.Series[0].DataPoints.DefaultDataPoint.DataLabels.IsValue = true;
    chart.Series[0].DataPoints.DefaultDataPoint.DataLabels.Size = 8;
    chart.Legend.Position = OfficeLegendPosition.Right;
    //Save and close the presentation
    pptxDoc.Save("WaterFall.pptx");
    pptxDoc.Close();
}
'Creates a PowerPoint instance
Dim pptxDoc As IPresentation = Presentation.Create()
Dim slide1 As ISlide = pptxDoc.Slides.Add(SlideLayoutType.Blank)
'Create a chart
Dim chart As IPresentationChart = slide1.Charts.AddChart(50, 50, 700, 400)
'Set chart type as Waterfall
chart.ChartType = OfficeChartType.WaterFall
'Set data range
chart.DataRange = chart.ChartData(1, 1, 8, 2)
chart.IsSeriesInRows = False
chart.ChartData.SetValue(2, 1, "Start")
chart.ChartData.SetValue(2, 2, 120000)
chart.ChartData.SetValue(3, 1, "Product Revenue")
chart.ChartData.SetValue(3, 2, 570000)
chart.ChartData.SetValue(4, 1, "Service Revenue")
chart.ChartData.SetValue(4, 2, 230000)
chart.ChartData.SetValue(5, 1, "Positive Balance")
chart.ChartData.SetValue(5, 2, 920000)
chart.ChartData.SetValue(6, 1, "Fixed Costs")
chart.ChartData.SetValue(6, 2, -345000)
chart.ChartData.SetValue(7, 1, "Variable Costs")
chart.ChartData.SetValue(7, 2, -230000)
chart.ChartData.SetValue(8, 1, "Total")
chart.ChartData.SetValue(8, 2, 345000)
'Data point settings as total in chart
Dim series As IOfficeChartSerie = chart.Series(0)
chart.Series(0).DataPoints(3).SetAsTotal = True
chart.Series(0).DataPoints(6).SetAsTotal = True
'Showing the connector lines between data points
chart.Series(0).SerieFormat.ShowConnectorLines = True
'Set the chart title
chart.ChartTitle = "Company Profit (in USD)"
'Formatting data label and legend option
chart.Series(0).DataPoints.DefaultDataPoint.DataLabels.IsValue = True
chart.Series(0).DataPoints.DefaultDataPoint.DataLabels.Size = 8
chart.Legend.Position = OfficeLegendPosition.Right
'Save and close the presentation
pptxDoc.Save("WaterFall.pptx")
pptxDoc.Close()You can download a complete working sample from GitHub.
The following screenshot shows the output of previous code.
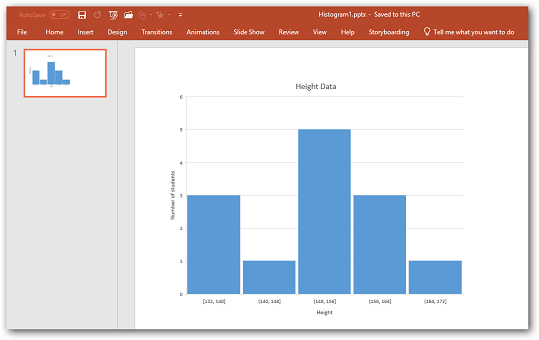
Histogram
Histogram shows the frequencies within a distribution. Each column of the chart is called a bin, which can be changed further to analyze the data. Refer to the following code example to create a Histogram.
//Creates a new instance of PowerPoint Presentation
IPresentation pptxDoc = Presentation.Create();
ISlide slide1 = pptxDoc.Slides.Add(SlideLayoutType.Blank);
IPresentationChart chart = slide1.Charts.AddChart(50, 50, 500, 400);
chart.ChartType = OfficeChartType.Histogram;

chart.DataRange = chart.ChartData[2, 1, 15, 1];
chart.ChartData.SetValue(1, 1, "Student Heights");
chart.ChartData.SetValue(2, 1, 130);
chart.ChartData.SetValue(3, 1, 132);
chart.ChartData.SetValue(4, 1, 159);
chart.ChartData.SetValue(5, 1, 163);
chart.ChartData.SetValue(6, 1, 140);
chart.ChartData.SetValue(7, 1, 155);
chart.ChartData.SetValue(8, 1, 139);
chart.ChartData.SetValue(9, 1, 143);
chart.ChartData.SetValue(10, 1, 153);
chart.ChartData.SetValue(11, 1, 165);
chart.ChartData.SetValue(12, 1, 153);
chart.ChartData.SetValue(13, 1, 149);
chart.ChartData.SetValue(14, 1, 154);
chart.ChartData.SetValue(15, 1, 162);

//Category axis bin settings
chart.PrimaryCategoryAxis.BinWidth = 8;
//Gap width settings
chart.Series[0].SerieFormat.CommonSerieOptions.GapWidth = 6;
//Set the chart title and axis title
chart.ChartTitle = "Height Data";
chart.PrimaryValueAxis.Title = "Number of students";
chart.PrimaryCategoryAxis.Title = "Height";
//Hiding the legend
chart.HasLegend = false;
//Save and close the presentation
pptxDoc.Save("Histogram.pptx");
pptxDoc.Close();using(IPresentation pptxDoc = Presentation.Create())
{
ISlide slide1 = pptxDoc.Slides.Add(SlideLayoutType.Blank);
IPresentationChart chart = slide1.Charts.AddChart(50, 50, 500, 400);
chart.ChartType = OfficeChartType.Histogram;
chart.DataRange = chart.ChartData[2, 1, 15, 1];
chart.ChartData.SetValue(1, 1, "Student Heights");
chart.ChartData.SetValue(2, 1, 130);
chart.ChartData.SetValue(3, 1, 132);
chart.ChartData.SetValue(4, 1, 159);
chart.ChartData.SetValue(5, 1, 163);
chart.ChartData.SetValue(6, 1, 140);
chart.ChartData.SetValue(7, 1, 155);
chart.ChartData.SetValue(8, 1, 139);
chart.ChartData.SetValue(9, 1, 143);
chart.ChartData.SetValue(10, 1, 153);
chart.ChartData.SetValue(11, 1, 165);
chart.ChartData.SetValue(12, 1, 153);
chart.ChartData.SetValue(13, 1, 149);
chart.ChartData.SetValue(14, 1, 154);
chart.ChartData.SetValue(15, 1, 162);
//Category axis bin settings
chart.PrimaryCategoryAxis.BinWidth = 8;
//Gap width settings
chart.Series[0].SerieFormat.CommonSerieOptions.GapWidth = 6;
//Set the chart title and axis title
chart.ChartTitle = "Height Data";
chart.PrimaryValueAxis.Title = "Number of students";
chart.PrimaryCategoryAxis.Title = "Height";
//Hiding the legend
chart.HasLegend = false;
//Save and close the presentation
pptxDoc.Save("Histogram.pptx");
pptxDoc.Close();
}'Creates a PowerPoint instance
Dim pptxDoc As IPresentation = Presentation.Create()
Dim slide1 As ISlide = pptxDoc.Slides.Add(SlideLayoutType.Blank)
Dim chart As IPresentationChart = slide1.Charts.AddChart(50, 50, 500, 400)
chart.ChartType = OfficeChartType.Histogram
chart.DataRange = chart.ChartData(2, 1, 15, 1)
chart.ChartData.SetValue(1, 1, "Student Heights")
chart.ChartData.SetValue(2, 1, 130)
chart.ChartData.SetValue(3, 1, 132)
chart.ChartData.SetValue(4, 1, 159)
chart.ChartData.SetValue(5, 1, 163)
chart.ChartData.SetValue(6, 1, 140)
chart.ChartData.SetValue(7, 1, 155)
chart.ChartData.SetValue(8, 1, 139)
chart.ChartData.SetValue(9, 1, 143)
chart.ChartData.SetValue(10, 1, 153)
chart.ChartData.SetValue(11, 1, 165)
chart.ChartData.SetValue(12, 1, 153)
chart.ChartData.SetValue(13, 1, 149)
chart.ChartData.SetValue(14, 1, 154)
chart.ChartData.SetValue(15, 1, 162)
'Category axis bin settings
chart.PrimaryCategoryAxis.BinWidth = 8
'Gap width settings
chart.Series(0).SerieFormat.CommonSerieOptions.GapWidth = 6
'Set the chart title and axis title
chart.ChartTitle = "Height Data"
chart.PrimaryValueAxis.Title = "Number of students"
chart.PrimaryCategoryAxis.Title = "Height"
'Hiding the legend
chart.HasLegend = False
'Save and close the presentation
pptxDoc.Save("Histogram.pptx")
pptxDoc.Close()You can download a complete working sample from GitHub.
The following screenshot shows the output of previous code.
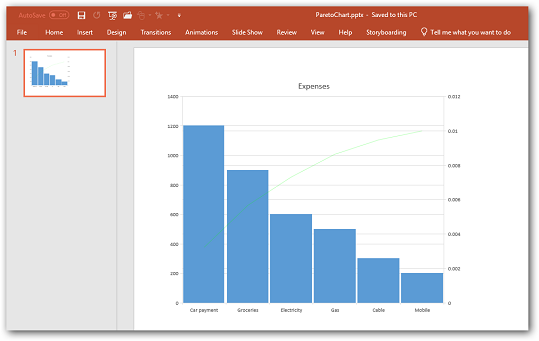
Pareto
Pareto is a sorted histogram in which the columns sorted in descending order and a line representing the cumulative total percentage. . Refer to the following code example to create a Pareto chart.
//Creates a new instance of PowerPoint Presentation
IPresentation pptxDoc = Presentation.Create();
//Adds a slide to Presentation
ISlide slide1 = pptxDoc.Slides.Add(SlideLayoutType.Blank);
IPresentationChart chart = slide1.Charts.AddChart(50, 50, 500, 400);
//Set chart type as Pareto
chart.ChartType = OfficeChartType.Pareto;

//Set data range
chart.DataRange = chart.ChartData[2, 1, 8, 2];
chart.ChartData.SetValue(2, 1, "Rent");
chart.ChartData.SetValue(2, 2, 2300);
chart.ChartData.SetValue(3, 1, "Car payment");
chart.ChartData.SetValue(3, 2, 1200);
chart.ChartData.SetValue(4, 1, "Groceries");
chart.ChartData.SetValue(4, 2, 900);
chart.ChartData.SetValue(5, 1, "Electricity");
chart.ChartData.SetValue(5, 2, 600);
chart.ChartData.SetValue(6, 1, "Gas");
chart.ChartData.SetValue(6, 2, 500);
chart.ChartData.SetValue(7, 1, "Cable");
chart.ChartData.SetValue(7, 2, 300);
chart.ChartData.SetValue(8, 1, "Mobile");
chart.ChartData.SetValue(8, 2, 200);

//Set category values as bin values
chart.PrimaryCategoryAxis.IsBinningByCategory = true;
//Formatting Pareto line
chart.Series[0].ParetoLineFormat.LineProperties.ColorIndex = OfficeKnownColors.Bright_green;
//Gap width settings
chart.Series[0].SerieFormat.CommonSerieOptions.GapWidth = 6;
//Set the chart title
chart.ChartTitle = "Expenses";
//Hiding the legend
chart.HasLegend = false;
//Save and close the presentation
pptxDoc.Save("ParetoChart.pptx");
pptxDoc.Close();using(IPresentation pptxDoc = Presentation.Create())
{
ISlide slide1 = pptxDoc.Slides.Add(SlideLayoutType.Blank);
IPresentationChart chart = slide1.Charts.AddChart(50, 50, 500, 400);
//Set chart type as Pareto
chart.ChartType = OfficeChartType.Pareto;
//Set data range
chart.DataRange = chart.ChartData[2, 1, 8, 2];
chart.ChartData.SetValue(2, 1, "Rent");
chart.ChartData.SetValue(2, 2, 2300);
chart.ChartData.SetValue(3, 1, "Car payment");
chart.ChartData.SetValue(3, 2, 1200);
chart.ChartData.SetValue(4, 1, "Groceries");
chart.ChartData.SetValue(4, 2, 900);
chart.ChartData.SetValue(5, 1, "Electricity");
chart.ChartData.SetValue(5, 2, 600);
chart.ChartData.SetValue(6, 1, "Gas");
chart.ChartData.SetValue(6, 2, 500);
chart.ChartData.SetValue(7, 1, "Cable");
chart.ChartData.SetValue(7, 2, 300);
chart.ChartData.SetValue(8, 1, "Mobile");
chart.ChartData.SetValue(8, 2, 200);
//Set category values as bin values
chart.PrimaryCategoryAxis.IsBinningByCategory = true;
//Formatting Pareto line
chart.Series[0].ParetoLineFormat.LineProperties.ColorIndex = OfficeKnownColors.Bright_green;
//Gap width settings
chart.Series[0].SerieFormat.CommonSerieOptions.GapWidth = 6;
//Set the chart title
chart.ChartTitle = "Expenses";
//Hiding the legend
chart.HasLegend = false;
//Save and close the presentation
pptxDoc.Save("ParetoChart.pptx");
pptxDoc.Close();
}'Creates a PowerPoint instance
Dim pptxDoc As IPresentation = Presentation.Create()
Dim slide1 As ISlide = pptxDoc.Slides.Add(SlideLayoutType.Blank)
Dim chart As IPresentationChart = slide1.Charts.AddChart(50, 50, 500, 400)
'Set chart type as Pareto
chart.ChartType = OfficeChartType.Pareto
'Set data range
chart.DataRange = chart.ChartData(2, 1, 8, 2)
chart.ChartData.SetValue(2, 1, "Rent")
chart.ChartData.SetValue(2, 2, 2300)
chart.ChartData.SetValue(3, 1, "Car payment")
chart.ChartData.SetValue(3, 2, 1200)
chart.ChartData.SetValue(4, 1, "Groceries")
chart.ChartData.SetValue(4, 2, 900)
chart.ChartData.SetValue(5, 1, "Electricity")
chart.ChartData.SetValue(5, 2, 600)
chart.ChartData.SetValue(6, 1, "Gas")
chart.ChartData.SetValue(6, 2, 500)
chart.ChartData.SetValue(7, 1, "Cable")
chart.ChartData.SetValue(7, 2, 300)
chart.ChartData.SetValue(8, 1, "Mobile")
chart.ChartData.SetValue(8, 2, 200)
'Set category values as bin values
chart.PrimaryCategoryAxis.IsBinningByCategory = True
'Formatting Pareto line
chart.Series(0).ParetoLineFormat.LineProperties.ColorIndex = OfficeKnownColors.Bright_green
'Gap width settings
chart.Series(0).SerieFormat.CommonSerieOptions.GapWidth = 6
'Set the chart title
chart.ChartTitle = "Expenses"
'Hiding the legend
chart.HasLegend = False
'Save and close the presentation
pptxDoc.Save("ParetoChart.pptx")
pptxDoc.Close()You can download a complete working sample from GitHub.
The following screenshot shows the output of previous code.
NOTE
These charts are supported only in PowerPoint 2016 and are not supported in the previous versions.
Supported Chart Types
The following Chart types are supported in Presentation.
- Area
- Area_3D
- Area_Stacked
- Area_Stacked_100
- Area_Stacked_100_3D
- Area_Stacked_3D
- Bar_Clustered
- Bar_Clustered_3D
- Bar_Stacked
- Bar_Stacked_100
- Bar_Stacked_100_3D
- Bar_Stacked_3D
- Bubble
- Bubble_3D
- Column_3D
- Column_Clustered
- Column_Clustered_3D
- Column_Stacked
- Column_Stacked_100
- Column_Stacked_100_3D
- Column_Stacked_3D
- Combination_Chart
- Cone_Bar_Clustered
- Cone_Bar_Stacked
- Cone_Bar_Stacked_100
- Cone_Clustered
- Cone_Clustered_3D
- Cone_Stacked
- Cone_Stacked_100
- Cylinder_Bar_Clustered
- Cylinder_Bar_Stacked
- Cylinder_Bar_Stacked_100
- Cylinder_Clustered
- Cylinder_Clustered_3D
- Cylinder_Stacked
- Cylinder_Stacked_100
- Doughnut
- Doughnut_Exploded
- Line
- Line_3D
- Line_Markers
- Line_Markers_Stacked
- Line_Markers_Stacked_100
- Line_Stacked
- Line_Stacked_100
- Pie
- Pie_3D
- Pie_Bar
- Pie_Exploded
- Pie_Exploded_3D
- PieOfPie
- Pyramid_Bar_Clustered
- Pyramid_Bar_Stacked
- Pyramid_Bar_Stacked_100
- Pyramid_Clustered
- Pyramid_Clustered_3D
- Pyramid_Stacked
- Pyramid_Stacked_100
- Radar
- Radar_Filled
- Radar_Markers
- Scatter_Line
- Scatter_Line_Markers
- Scatter_Markers
- Scatter_SmoothedLine
- Scatter_SmoothedLine_Markers
- Stock_HighLowClose
- Stock_OpenHighLowClose
- Stock_VolumeHighLowClose
- Stock_VolumeOpenHighLowClose
- Surface_3D
- Surface_Contour
- Surface_NoColor_3D
- Surface_NoColor_Contour
Online Demo
- Explore how to create charts in a PowerPoint presentation using the .NET PowerPoint Library (Presentation) in a live demo here.