How can I help you?
Series
Series point customization
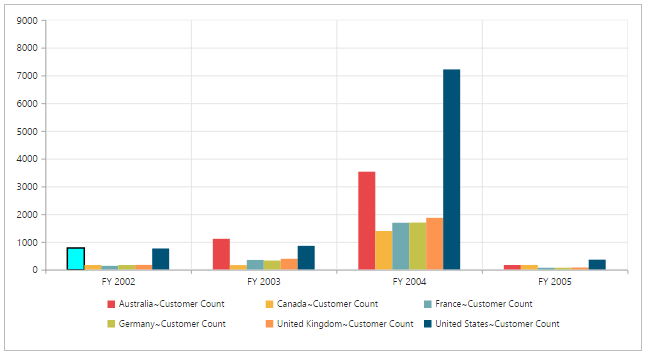
By using the fill and border properties of chart series, you can customize the pivot chart series color, border color, and border width.
<html xmlns="http://www.w3.org/1999/xhtml">
//...

<body>
    <ej:PivotChart ID="MyPivotChart1" runat="server" Url="/RelationalChartService.svc" ClientIDMode="Static">
        <ClientSideEvents Load="loadTheme" SeriesRendering="onSeriesRenders" />
          <Size Width="100%" Height="460px"></Size>
    </ej:PivotChart>
    <script type="text/javascript">
        function onSeriesRenders(args) {
            this.model.series[0].points[0].fill = "aqua";
            this.model.series[0].points[0].border = {
                color: "black",
                width: 2
            };
        }
    </script>
</body>

</html>