How can I help you?
Rulers
The Ruler provides a Horizontal and Vertical guide for measuring in the Diagram control. The Ruler can be used to measure the Diagram objects, indicate positions, and align Diagram elements. This is especially useful in creating scale models.
Adding Rulers to the Diagram
Rulers can be enabled by setting the ruler Setting’s ShowRulers property for the diagram control.
Use the following code example to enable/disable the ruler to the Diagram.
<ej:Diagram ClientIDMode="Static" ID="DiagramWebControl1" runat="server" Height="600px" Width="100%" EnableContextMenu="false">
            <RulerSettings ShowRulers="true">
            </RulerSettings>
    </ej:Diagram>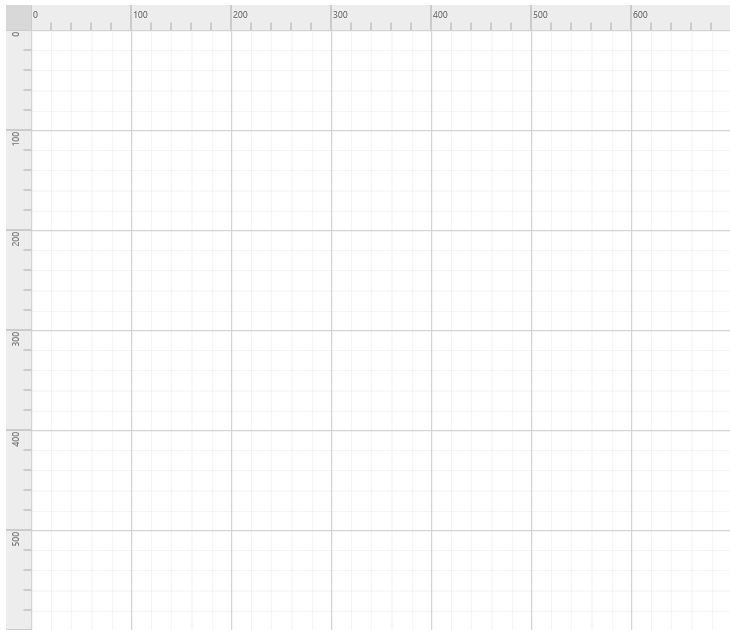
Customizing the Ruler
The rulerSetting’s Interval property is used to define the number of tick’s between two major stroke lines of the ruler.
The ruler Setting’s SegmentWidth is used to defines the space between the two major tick strokes.
The ArrangeTick event will be triggered when each tick have been drawn.By using this event you can customize the length of the tick.
Use the following code example to customize the ruler’s segment.
<ej:Diagram ClientIDMode="Static" ID="DiagramWebControl1" runat="server" Height="600px" Width="100%" EnableContextMenu="false">
            <RulerSettings ShowRulers="true">
                <HorizontalRuler ArrangeTick="arrangeTick" SegmentWidth="100" Interval="6" />
                <VerticalRuler ArrangeTick="arrangeTick" SegmentWidth="100" Interval="6" />
            </RulerSettings>
    </ej:Diagram>
function arrangeTick(args) {
// Customizing the Ruler ticks.
if (args.tickInterval % 100 == 0) {
}
else if (args.tickInterval % 50 == 0) {
args.tickLength = 12.5
}
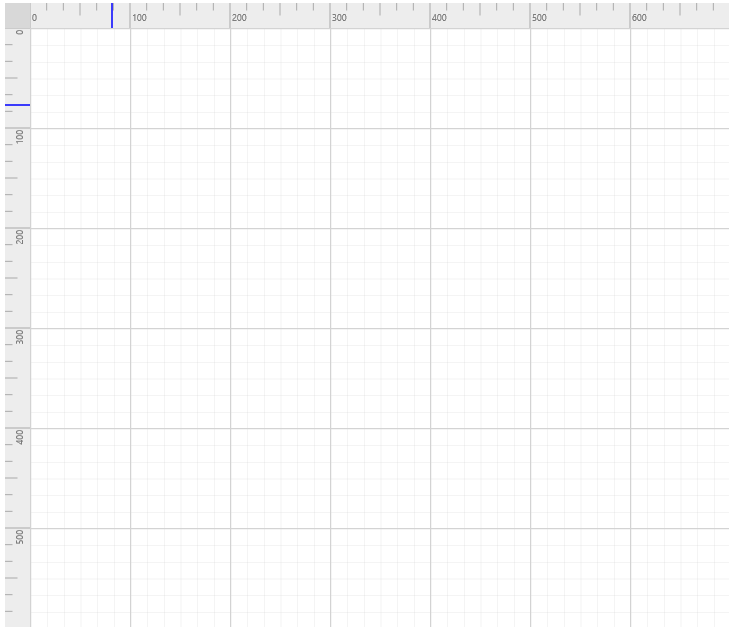
}The width of the ruler can be set through Thickness property. If it’s an horizontal ruler, thickness will be taken as height of the ruler.
Tick alignment can be modified using TickAlignment as either LeftOrTop or RightOrBottom.
The MarkerColor property of the ruler is used to indicate the position of the mouse cursor.
Use the following code example to customize the ruler’s tick.
<ej:Diagram ClientIDMode="Static" ID="DiagramWebControl1" runat="server" Height="600px" Width="100%" EnableContextMenu="false">
            <RulerSettings ShowRulers="true">
                <HorizontalRuler TickAlignment="LeftOrTop" Thickness="25" MarkerColor="red" />
                <VerticalRuler TickAlignment="LeftOrTop" Thickness="25" MarkerColor="red" />
            </RulerSettings>
    </ej:Diagram>