How can I help you?
Getting Started with ASP.NET Webforms Diagram
This section explains briefly you on how to create a Diagram in your application with ASP.NET. Getting started with your ASP.NET Diagram is very easy. You can start by creating a simple flow Chart.
Flow Diagram
Initialize Diagram
1. Create an ASP.NET Application and add necessary assemblies and Scripts by referring ASP-Getting Started Documentation.
2. Create a Web Form named as Diagram and add the following template.
<%@ Page Language="C#" AutoEventWireup="true" CodeBehind="Diagram.aspx.cs" Inherits="WebApplication2.Diagram" %>

<!DOCTYPE html>
<html>
<head runat="server">
    <title>Getting started for ASP.NET Diagram Control</title>
    <link href="Content/ej/web/default-theme/ej.web.all.min.css" rel="stylesheet" />
    <script src='<%= Page.ResolveClientUrl("~/Scripts/jquery-2.1.4.min.js")%>' type="text/javascript"></script>
    <script src='<%= Page.ResolveClientUrl("~/Scripts/jquery.easing-1.3.min.js")%>' type="text/javascript"></script>
    <script src='<%= Page.ResolveClientUrl("~/Scripts/jquery.globalize.min.js")%>' type="text/javascript"></script>
    <script src='<%= Page.ResolveClientUrl("~/Scripts/jsrender.min.js")%>' type="text/javascript"></script>
    <script src='<%= Page.ResolveClientUrl("~/Scripts/ej/ej.web.all.min.js")%>' type="text/javascript"></script>
    <script src='<%= Page.ResolveClientUrl("~/Scripts/ej/ej.webform.min.js")%>' type="text/javascript"></script>
</head>
<body>
    <form runat="server">
        <ej:Diagram runat="server" ClientIDMode="Static" ID="DiagramWebControl" Width="100%" Height="600px"></ej:Diagram>
    </form>
</body>
</html>
3. This creates an empty diagram
Adding the List of Namespaces
The following list of namespaces needs to be added on the top of the aspx code file for creating the diagram objects such as nodes and connectors.
- using Syncfusion.JavaScript.DataVisualization.DiagramEnums;
- using Syncfusion.JavaScript.DataVisualization.Models;
- using Syncfusion.JavaScript.DataVisualization.Models.Collections;
- using Syncfusion.JavaScript.DataVisualization.Models.Diagram;
Create and add Node
Let us create and add a node with specific position, size, label and shape.
The following code example to create and add nodes into the diagram.
<ej:Diagram runat="server" ClientIDMode="Static" ID="DiagramWebControl" Width="100%" Height="600px"></ej:Diagram>public partial class FlowChartDiagram : Page
{
protected void Page_Load(object sender, EventArgs e)
{
if (!IsPostBack)
{
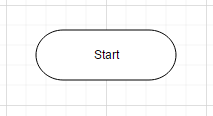
DiagramWebControl.Nodes.Add(CreateNode("Start", 50, FlowShapes.Terminator, "Start"));
}
}
FlowShape CreateNode(string name, int offsetY, FlowShapes shape, string text)
{
FlowShape node = new FlowShape()
{
Shape = shape,
Name = name,
OffsetY = offsetY,
Labels = new Collection() { new Label() { Text = text } }
};
return node;
}
}NOTE
Labelsproperty is an array, which indicates that more than one label can be added to a node.
- Default values for all nodes can be set using default settings. For example if all nodes have same
WidthandHeight, we can move such properties intoDefaultSettings.Nodeby using below code example.
public partial class FlowChartDiagram : Page
    {
        protected void Page_Load(object sender, EventArgs e)
        {
            if (!IsPostBack)
            {
                //Default Settings
                DiagramWebControl.Model.DefaultSettings.Node = new Node()
                {
                    Type = Shapes.Flow,
                    Width = 140,
                    Height = 50,
                    OffsetX = 300
                };
            }
        }
    }
Added node will be displayed in diagram as shown below.
Connect nodes
- Create another
nodewith another set of data.
public partial class FlowChartDiagram : Page
{
protected void Page_Load(object sender, EventArgs e)
{
if (!IsPostBack)
{
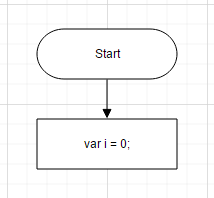
DiagramWebControl.Nodes.Add(CreateNode("Start", 140, 50, 300, 50, FlowShapes.Terminator, "Start"));
DiagramWebControl.Nodes.Add(CreateNode("Init", 140, 50, 300, 140, FlowShapes.Process, "var i = 0;"));
}
}
//Helper method
FlowShape CreateNode(string name, int offsetY, FlowShapes shape, string text)
{
FlowShape node = new FlowShape()
{
Shape = shape,
Name = name,
OffsetY = offsetY,
Labels = new Collection() { new Label() { Text = text } }
};
return node;
}
}Connect these two nodes by adding a connector into Connectors collection with reference to source and target end.
public partial class FlowChartDiagram : Page
    {
        protected void Page_Load(object sender, EventArgs e)
        {
            if (!IsPostBack)
            {
                //Add a connector to `Connectors` collection of diagram model
                DiagramWebControl.Connectors.Add(ConnectNodes("connector1", "Start", "Init"));
            }
        }

        //Helper method
        Connector ConnectNodes(string name, string source, string target, string text = "", Segment segment = null)
        {
            return new Connector()
            {
                Name = name,
                SourceNode = source,
                TargetNode = target,
                Labels = new Collection() { new Label() { Text = text } },
                Segments = new Collection() {
                segment != null? segment: new Segment(Segments.Orthogonal)
                }
            };
        }
}-
Connectorconnects the two nodes as shown below.
- Default values for all connectors can be set using default settings. For example if all connectors have same ‘Labels’ appearance, we can move such properties into
DefaultSettings.Connectorby using below below code example.
public partial class FlowChartDiagram : Page
{
protected void Page_Load(object sender, EventArgs e)
{
if (!IsPostBack)
{
//Default Settings
DiagramWebControl.Model.DefaultSettings.Connector = new Connector()
{
Labels = new Collection() { new Label() { FillColor = "white" } },
Segments = new Collection() { new Segment(Segments.Orthogonal) }
};
}
}
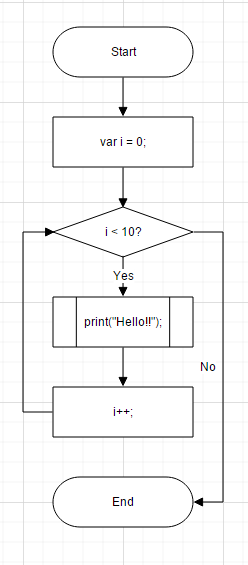
}Complete flow diagram
Similarly we can add required nodes and connectors to form a complete flow diagram.
using Syncfusion.JavaScript.DataVisualization.DiagramEnums;
    using Syncfusion.JavaScript.DataVisualization.Models;
    using Syncfusion.JavaScript.DataVisualization.Models.Collections;
    using Syncfusion.JavaScript.DataVisualization.Models.Diagram;
    using Syncfusion.JavaScript.Models;
    using System;
    using System.Collections.Generic;
    using System.Linq;
    using System.Web;
    using System.Web.UI;
    using System.Web.UI.WebControls;
    using Label = Syncfusion.JavaScript.DataVisualization.Models.Diagram.Label;
    using System.Web.Services;

    namespace FlowChartApplication1
    {
        public partial class FlowChartDiagram : Page
        {
            protected void Page_Load(object sender, EventArgs e)
            {
                if (!IsPostBack)
                {
                    //Default Settings
                    DiagramWebControl.Model.DefaultSettings.Node = new Node()
                    {
                        Type = Shapes.Flow,
                        Width = 140,
                        Height = 50,
                        OffsetX = 300
                    };
                    DiagramWebControl.Model.DefaultSettings.Connector = new Connector()
                    {
                        Labels = new Collection() { new Label() { FillColor = "white" } },
                        Segments = new Collection() { new Segment(Segments.Orthogonal) }
                    };

                    DiagramWebControl.Nodes.Add(CreateNode("Start", 50, FlowShapes.Terminator, "Start"));
                    DiagramWebControl.Nodes.Add(CreateNode("Init", 140, FlowShapes.Process, "var i = 0;"));
                    DiagramWebControl.Nodes.Add(CreateNode("Condition", 230, FlowShapes.Decision, "i < 10?"));
                    DiagramWebControl.Nodes.Add(CreateNode("Print", 320, FlowShapes.PreDefinedProcess, "i < 10?"));
                    DiagramWebControl.Nodes.Add(CreateNode("Increment", 410, FlowShapes.Process, "i < 10?"));
                    DiagramWebControl.Nodes.Add(CreateNode("End", 500, FlowShapes.Terminator, "i < 10?"));

                    //Connect Nodes
                    DiagramWebControl.Connectors.Add(ConnectNodes("connector1", "Start", "Init"));
                    DiagramWebControl.Connectors.Add(ConnectNodes("connector2", "Init", "Condition"));
                    DiagramWebControl.Connectors.Add(ConnectNodes("connector3", "Condition", "Print", "Yes"));
                    DiagramWebControl.Connectors.Add(ConnectNodes("connector4", "Condition", "End", "No",
                        new Segment() { Type = Segments.Orthogonal, Direction = "right", Length = 30 }));
                    DiagramWebControl.Connectors.Add(ConnectNodes("connector5", "Print", "Increment"));
                    DiagramWebControl.Connectors.Add(ConnectNodes("connector5", "Increment", "Condition", "",
                      new Segment() { Type = Segments.Orthogonal, Direction = "left", Length = 30 }));
                }
            }

            //Helper methods
            FlowShape CreateNode(string name, int offsetY, FlowShapes shape, string text)
            {
                FlowShape node = new FlowShape()
                {
                    Shape = shape,
                    Name = name,
                    OffsetY = offsetY,
                    Labels = new Collection() { new Label() { Text = text } }
                };
                return node;
            }

            Connector ConnectNodes(string name, string source, string target, string text = "", Segment segment = null)
            {
                Connector connector = new Connector()
                {
                    Name = name,
                    SourceNode = source,
                    TargetNode = target,
                    Labels = new Collection() { new Label() { Text = text } },
                    Segments = new Collection() {
                     segment != null? segment: new Segment(Segments.Orthogonal)
                    }
                };
                return connector;
            }
        }
    }
Final flow chart will looks as shown below.
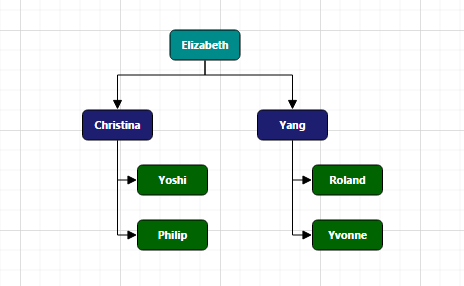
Automatic organization chart
In ‘Flow Diagram’ section we saw how to create a diagram manually, now let us see how to create and position diagram automatically.
Initialize diagram
Initializing diagram is already discussed in Flow Diagram > Initialize diagram section.
Business object (Employee information)
- Define Employee Information as JSON data. The following code example shows an employee array whose,
-
Nameis used as a unique identifier and -
ReportingPersonis used to identify the person to whom an employee report to, in the organization.
-
//Initialize data source - Saved in a JSON file...
{
    data: [
        { Name: "Elizabeth", Role: "Director" },
        { Name: "Christina", ReportingPerson: "Elizabeth", Role: "Manager" },
        { Name: "Yoshi", ReportingPerson: "Christina", Role: "Lead" },
        { Name: "Philip", ReportingPerson: "Christina", Role: "Lead" },
        { Name: "Yang", ReportingPerson: "Elizabeth", Role: "Manager" },
        { Name: "Roland", ReportingPerson: "Yang", Role: "Lead" },
        { Name: "Yvonne", ReportingPerson: "Yang", Role: "Lead" }
    ]
}
Map data source
- You can configure this “Employee Information” with Diagram, so that the node and connector are automatically generated using mapping properties. The following code examples show how dataSourceSetting is used to map id and parent with property name identifiers for employee information.
<ej:Diagram runat="server" ID="Diagram" ClientIDMode="Static" Width="100%" Height="600px">
         <DataSourceSettings Id="Name" Parent="ReportingPerson" />
     </ej:Diagram>
protected void Page_Load(object sender, EventArgs e)
{
if (!IsPostBack)
DiagramWebControl.DataSourceSettings.DataSource = GetEmployeeDetails();
}
//Helper method
Array GetEmployeeDetails()
{
string text = System.IO.File.ReadAllText(Server.MapPath("~/App_Data/employee.json"));
Dictionary<string, object> data = (Dictionary<string, object>)new JavaScriptSerializer().DeserializeObject(text);
return (Array)data["data"];
}Visualize employee
Following code examples indicate how to define the default appearance of node and connector using defaultSetting. The NodeTemplate is used to update each node based on employee data.
//Configure data source
     DiagramWebControl.DataSourceSettings.DataSource = GetEmployeeData();

     //Default Settings
     DiagramWebControl.Model.DefaultSettings.Node = new Node()
     {
         Width = 70,
         Height = 30,
         Shape = { Type = Shapes.Rectangle, CornerRadius = 5 },
         Labels = new Collection() { new Label() { FontSize = 11, Bold = true, FontFamily = "Segoe UI", FontColor = "white" } }
     };

     DiagramWebControl.Model.DefaultSettings.Connector = new Connector()
     {
         Segments = new Collection() { new Segment(Segments.Orthogonal) }
     };

     DiagramWebControl.NodeTemplate = "nodeTemplate";
//To represent the roles
var codes = {
Director: "rgb(0, 139,139)",
Manager: "rgb(30, 30,113)",
Lead: "rgb(0, 100,0)"
}
// Bind custom data with node
function nodeTemplate(diagram, node) {
node.labels[0].text = node.Name;
node.fillColor = codes[node.Role];
}Apply org chart layout
- Next you need to arrange nodes in an organizational chart structure, and to do this you can apply layout as shown in following code example. You can see that spacing, margin and orientation are defined, that can also be customized based on the needs.
<ej:Diagram runat="server" ID="DiagramWebControl" ClientIDMode="Static" Width="100%" Height="600px">
         <DataSourceSettings Id="Name" Parent="ReportingPerson" />
         <Layout Type="OrganizationalChart" HorizontalSpacing="50" VerticalSpacing="50"
             MarginX="10" MarginY="50" Orientation="TopToBottom" />
</ej:Diagram>- The Employee details are displayed in the Diagram as follows.