About Syncfusion® .NET MAUI TreeMap Control
18 Nov 20185 minutes to read
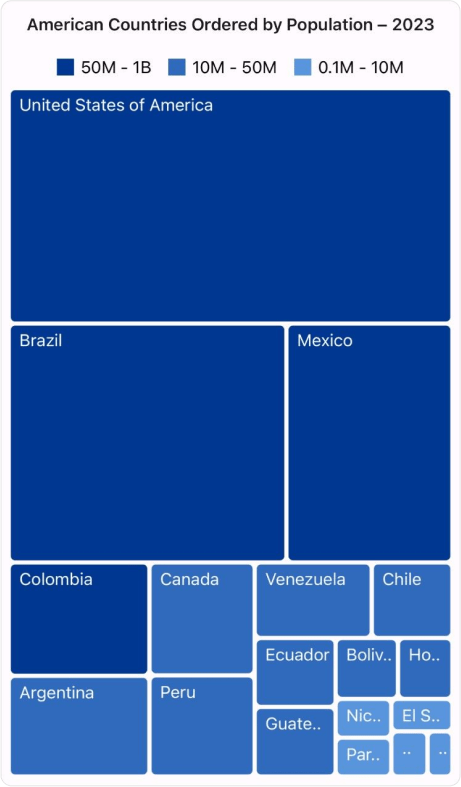
The Syncfusion® .NET MAUI TreeMap control allows you to visually represent hierarchical data with rectangles that are sized and colored based on underlying values. It efficiently displays grouped and nested data structures, offering various layout options, extensive customization options, and supports item selection, data binding to different sources, and more.
Business use cases
- Business intelligence applications that require visualizing hierarchical data, such as categories, subcategories, and performance metrics.
- Financial dashboards that display portfolio distribution, revenue contribution, or market segmentation.
- Analytics applications that require comparing proportional values across grouped datasets.
- Data-driven applications that need efficient visualization of large hierarchical datasets in a compact layout.
Key Features
- Data Binding allows binding structured data with multiple levels and categories.
- Layout allows choosing between layouts such as slice and dice or squarified for optimal visualization.
- Levels allows representing nested data structures with clear parent-child relationships.
- Brush Settings allows applying colors based on value ranges or categories for better interpretation.
- Legend allows providing visual guidance for understanding color and data mapping.
- Tooltip allows displaying additional information on interaction with tree map items.
- Interaction allows selecting and highlighting items for focused analysis.
- Accessibility and keyboard allows improving usability with keyboard navigation and inclusive design.
- Appearance customization allows modifying styles, layouts, and visual properties to match application requirements.
Globalization
The following table summarizes the globalization support available in this control.
 Full Support
 Partial Support
 No Support
| Control | Localization | RTL | Time zone | Screen reader | Keyboard navigation |
|---|---|---|---|---|---|
| TreeMap |  |
|
|
|
|
Related Controls
- Sunburst Chart for visualizing hierarchical data using a radial layout.
- .NET MAUI Cartesian Chart for analyzing data trends using axis-based charts.
- Maps for visualizing location-based hierarchical data.
See Also
- Getting Started shows a step‑by‑step guide to begin using the TreeMap control.
- Layouts explains how to configure layout types and data arrangement.
- Drilldown helps dive into details by exploring data hierarchies step by step.
- UI Kit provides interactive demos and ready‑made UI examples.
Resources
Feature Tour
Get a quick overview of key features and capabilities to kick start your journey.
Explore Features
Tutorial Videos
Watch step‑by‑step video guides to quickly understand concepts and implementation.
Watch now
Knowledge Base
Find practical solutions, troubleshooting tips and how‑to guides for common scenarios.
Search KB's