Data Labels in .NET MAUI Chart
29 Oct 20243 minutes to read
Data labels are used to display values related to a chart segment. Values from data point(x, y) or other custom properties from a data source can be displayed.
Enable Data Labels
To define the data label in the chart, set the ShowDataLabels property to true. The default value of ShowDataLabels property is false.
<chart:SfFunnelChart ShowDataLabels="True"/>
. . .
</chart:SfFunnelChart>
SfFunnelChart chart = new SfFunnelChart();
. . .
chart.ShowDataLabels = true;
this.Content = chart;Data label customization
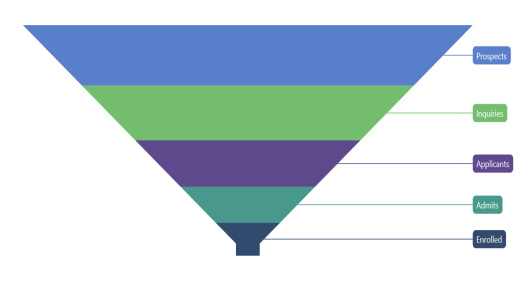
Data labels can be customized by using the DataLabelSettings property of the chart. For customizing, need to create an instance of FunnelDataLabelSettings and set to the DataLabelSettings property.The following properties, which are available in FunnelDataLabelSettings, are used to customize the data labels.
-
LabelPlacement- It used to position the funnel chart data labels at Auto, Inner, Center and Outer. -
UseSeriesPalette- It used to set the interior of the chart to the data label background. -
Contextof typeFunnelDataLabelContext, indicates weather to show x or y value in the label content. -
LabelStyle- It used to customize the data label’s appearance. The following properties, which are available in LabelStyle.-
Margin of type
Thickness, indicates the label’s margin. -
Background, of type
Brush, indicates the label background color. -
FontAttributes, of type
FontAttributes, indicates the font style of the data label. -
FontSize, of type
double, indicates the font size. -
Stroke, of type
Brush, indicates the brush used to paint the border of the data label. -
StrokeWidth, of type
double, indicates the width of the label’s border. -
CornerRadius, of type
CornerRadius, indicates the rounded corner for label. -
TextColor, of type
Color, indicates color of the displayed text.
-
Margin of type
<chart:SfFunnelChart ShowDataLabels="True">
    . . .
    <chart:SfFunnelChart.DataLabelSettings>
        <chart:FunnelDataLabelSettings LabelPlacement="Outer"
                                       Context="XValue"
                                       UseSeriesPalette="True">
            <chart:FunnelDataLabelSettings.LabelStyle>
                <chart:ChartDataLabelStyle Margin="2"/>
            </chart:FunnelDataLabelSettings.LabelStyle>
        </chart:FunnelDataLabelSettings>
    </chart:SfFunnelChart.DataLabelSettings>
</chart:SfFunnelChart>
SfFunnelChart chart = new SfFunnelChart();
. . .
chart.ShowDataLabels = true;
ChartDataLabelStyle labelStyle = new ChartDataLabelStyle()
{
Margin = 2,
};
chart.DataLabelSettings = new FunnelDataLabelSettings()
{
Context=FunnelDataLabelContext.XValue,
LabelPlacement=DataLabelPlacement.Outer,
UseSeriesPalette=true,
LabelStyle = labelStyle,
};
this.Content = chart;