.NET MAUI Sunburst Chart Overview
24 Jun 20251 minute to read
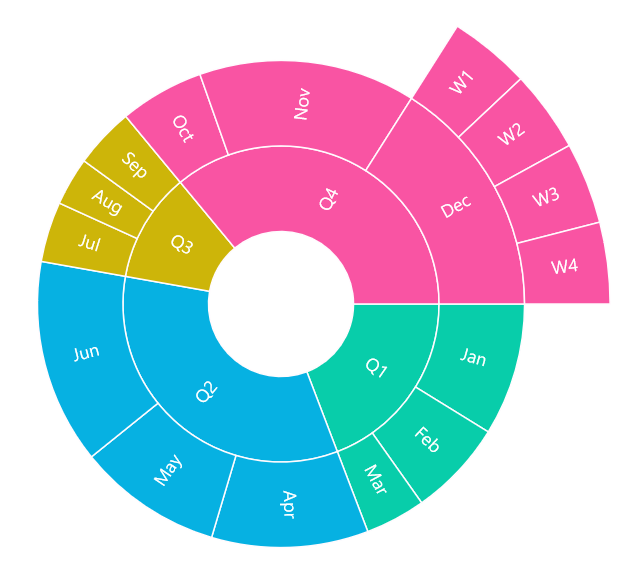
The Syncfusion® .NET MAUI Sunburst Chart is used to visualize hierarchical data structures. The chart organizes data in multiple levels, where each level represents a different category or subcategory. This visualization helps users understand relationships and dependencies within the data in an intuitive and user-friendly way.

Key features
- Data visualization - Represents hierarchical data with multiple levels of categories.
- Data labels - Supports data labels to improve readability of the segments.
- Legend - Provides legend support to help identify the segments.
- Tooltip - Displays tooltips to provide additional information about segments.
- Customization - Allows appearance customization with custom palette brushes.
- Center view - Supports center view elevation to display additional information.