- Normal Color Mapping
- Range Color Mapping
Contact Support
Color Mapping
13 Jul 20166 minutes to read
You can customize the colors of the leaf nodes of PivotTreeMap using the color mapping support.
Color mapping is categorized into two different types such as,
- Normal
- Range
You can color all the leaf nodes with the different colors by setting the color value of the rangeColorMapping property.
Normal Color Mapping
You can customize the nodes based on number of leaf items using different color ranges. You can also define the color value range using from and to properties.
The following code sample explains how to customize PivotTreeMap appearance using Normal mode (i.e., differentiate color based on number of the leaf items in each header).
<! --Create a tag which acts as a container for PivotTreeMap-->
@Html.EJ().Pivot().PivotTreeMap("PivotTreeMap1").DataSource(dataSource => dataSource.Rows(rows => { rows.FieldName("[Date].[Fiscal]").Add(); }).Columns(columns => { columns.FieldName("[Customer].[Customer Geography]").Add(); }).Values(values => { values.Measures(measures => { measures.FieldName("[Measures].[Customer Count]").Add(); }).Axis(AxisName.Column).Add(); }).Data("http://bi.syncfusion.com/olap/msmdpump.dll").Catalog("Adventure Works DW 2008 SE").Cube("Adventure Works")).ClientSideEvents(oEve => { oEve.RenderSuccess("onTypeChange"); })
<script type="text/javascript">
   function onTypeChange(args) {
         treemapTarget = $('#PivotTreeMap1TreeMapContainer').data("ejTreeMap");
         treemapTarget.model.colorValuePath = "";
         treemapTarget.model.enableGradient = false;
         treemapTarget.model.showLegend = false;
         treemapTarget.model.legendSettings.leftLabel = "";
         treemapTarget.model.legendSettings.rightLabel = "";
         treemapTarget.model.rangeColorMapping = [];
	     treemapTarget.model.colorValuePath = "Index";
         treemapTarget.model.rangeColorMapping.push(
         { color: "#9de24f", from: "0", to: "0" },
         { color: "#a2e2fe", from: "1", to: "1" },
         { color: "#ffff66", from: "2", to: "2" },
         { color: "#FF0040", from: "3", to: "3" },
         { color: "#f6b53f", from: "4", to: "4" },
         { color: "#6FAAB0", from: "5", to: "5" },
         { color: "#C4C24A", from: "6", to: "6" }
         )
	  treemapTarget.refresh();
   }
</script>

<! --Tooltip labels can be localized here-->
<script id="tooltipTemplate" type="application/jsrender">
    <div style="background:White; color:black; font-size:12px; font-weight:normal; border: 1px solid #4D4D4D; white-space: nowrap;border-radius: 2px; margin-right: 25px; min-width: 110px;padding-right: 5px; padding-left: 5px; padding-bottom: 2px ;width: auto; height: auto;">
        <div>Measure(s) : </div><div>Row : </div><div>Column : </div><div>Value : </div>
    </div>
</script>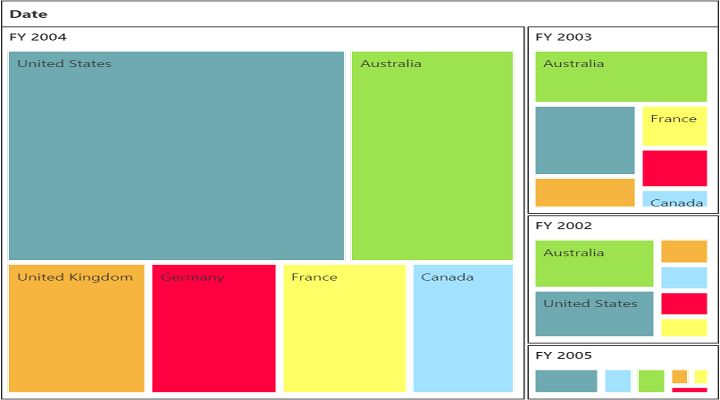
Range Color Mapping
You can customize the nodes based on its value and color ranges using Range color. You can also define the color value range using from and to properties.
The following code sample explains how to customize PivotTreeMap appearance using Range mode (i.e., differentiate color for leaf items based on values).
<script type="text/javascript">
   function onTypeChange(args) {
         treemapTarget = $('#PivotTreeMap1TreeMapContainer').data("ejTreeMap");
         treemapTarget.model.colorValuePath = "";
         treemapTarget.model.enableGradient = false;
         treemapTarget.model.showLegend = false;
         treemapTarget.model.legendSettings.leftLabel = "";
         treemapTarget.model.legendSettings.rightLabel = "";
         treemapTarget.model.rangeColorMapping = [];
	     treemapTarget.model.colorValuePath = "Value";
         treemapTarget.model.rangeColorMapping.push(
         { color: "#a2e2fe", from: "0", to: "10" },
         { color: "#9de24f", from: "11", to: "250" },
         { color: "#ffff66", from: "251", to: "1000" },
         { color: "#C4C24A", from: "1001", to: "3000" },
         { color: "#f6b53f", from: "3001", to: "5000" },
         { color: "#6FAAB0", from: "5001", to: "10000" },
         { color: "#FF0040", from: "10001", to: "20000" }
         )
	treemapTarget.refresh();
   }
</script>