Getting Started
22 Feb 201810 minutes to read
This section explains you the steps required to populate the RangeNavigator with data, add data labels, tooltips and title to the Chart. This section covers only the minimal features that you need to know to get started with the RangeNavigator.
Create your RangeNavigator
In this tutorial, you will learn how to create a simple RangeNavigator. The following screen shot displays the output after completing this tutorial.
Simple RangeNavigator
-
First, create a new ASP.NET core project; please refer ASP.NET core 1.0-Getting Started documentation to create new project and add necessary DLL’s and script files.
-
Create a data source in Controllers/HomeController.cs file, JSON data can be added to RangeNavigator using Datasource property in RangeNavigator.
<div>

 <ej-range-navigator id="range"></ej-range-navigator>

</div>
Now, the RangeNavigator is rendered with some auto-generated random values and with default Column chart type.### Configure RangeNavigator
Getting started with your Core RangeNavigator is simple; all you need to do is initialize the RangeNavigator by setting range values.
-
Create a simple <div> tag.
<div> </div> -
Add the following code in the SimpleRangeNavigator.cshtml file, to create the RangeNavigator control in the View page.
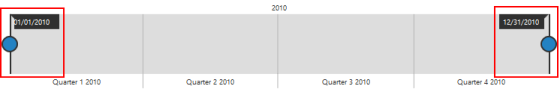
The following code example renders a RangeNavigator with a range from 2010 January 1st to December 31st.
~~~ cshtml
</div>
~~~
-
Open ~/Controllers/HomeController.cs.
-
Add the SimpleRangeNavigator() action as illustrated in the following code example.
 public ActionResult SimpleRangeNavigator()

{

	return View();

}
The following Screen shot displays the RangeNavigator with a range from 2010 January 1st to December 31st.
Add series
To add a series to RangeNavigator, you need to set DataSource property, as given in the following code example.
You can add JSON data to the RangeNavigator using the Datasource property.
In Controllers/HomeController.cs specify the data for data source.
public ArrayList GetData()

{

	ArrayList dataTable = new ArrayList();

	dataTable.Add(new NavigatorData (new DateTime(2011, 01, 01), 10));

	dataTable.Add(new NavigatorData (new DateTime(2011, 02, 01), 5));

	dataTable.Add(new NavigatorData (new DateTime(2011, 04, 01), 15));

	dataTable.Add(new NavigatorData (new DateTime(2011, 06, 01), 25));

	dataTable.Add(new NavigatorData (new DateTime(2011, 08, 01), 10));

	dataTable.Add(new NavigatorData (new DateTime(2011, 10, 01), 5));

	dataTable.Add(new NavigatorData (new DateTime(2011, 12, 31), 15));

	return dataTable;

}

class NavigatorData

{

	private DateTime XDate;

	public DateTime xDate

	{

		get { return XDate; }

		set { XDate = value; }

	}

	private double YValue;

	public double yValue

	{

		get { return YValue; }

		set { YValue = value; }

	}

	public NavigatorData(DateTime XDate, double YValue)

	{

		this.XDate = XDate;

		this.YValue = YValue;

	}

}


public IActionResult SimpleRangeNavigator()

{

	var DataSource = GetData();

	ViewBag.datasource = DataSource;

	return View();

}
In SimpleRangeNavigator.cshtml specify the type of series you want to render using “Type” property. And specify the Datasource to the Series of RangeNavigator.
<ej-range-navigator id="scrollcontent"
                        datasource="(System.Collections.IEnumerable)ViewBag.datasource"
                        x-name="xDate"
                        y-name="yValue">
</ej-range-navigator>
The following screenshot displays the RangeNavigator with the type series as “line”.
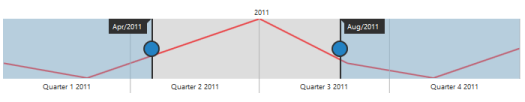
Enable tooltip
Tooltip can be customized for RangeNavigator using tooltip option. You can also use TooltipDisplayMode option in tooltip to display the tooltip “always” or “ondemand” (displays tooltip only while dragging the sliders). You can also specify label format for tooltip using LabelFormat.
<ej-range-navigator id="scrollcontent">
<e-range-tooltip-settings visible="true" label-format="MMM/yyyy" tooltip-display-mode="always">
</e-range-tooltip-settings>
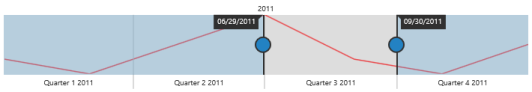
</ej-range-navigator>The following screen shot displays the label format Tooltip in RangeNavigator:
Update Chart
RangeNavigator is used along with the controls like chart and grid to view the range of data selected in RangeNavigator.
In order to update chart, whenever the selected range changes in RangeNavigator, you need to use RangeChanged event of RangeNavigator and then update the chart with the selected data in this event.
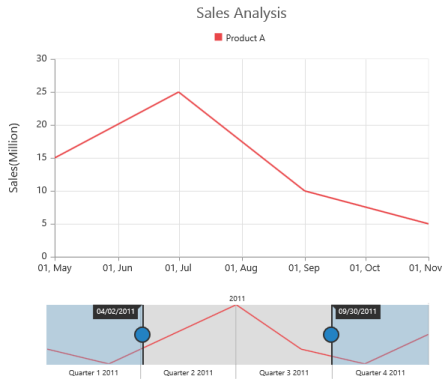
Now, add the DataSource to the series and provide the field name to get the values from the DataSource in XName and YName options and also trigger the RangeChanged event for updating the chart.
<ej-chart id="chartContainer">
        <e-title text="Sales Analysis"></e-title>
        <e-legend visible="true" position="Top"></e-legend>
        <e-primary-y-axis>
            <e-title text="Sales(Million)"></e-title>
        </e-primary-y-axis>
        <e-chart-series>
            <e-series name="Product A" type="Line"
                      datasource="(System.Collections.IEnumerable)ViewBag.datasource"
                        x-name="xDate"
                        y-name="yValue">
            </e-series>
        </e-chart-series>
</ej-chart>
<ej-range-navigator id="scrollcontent" range-changed="onRangeChanged"
                        datasource="(System.Collections.IEnumerable)ViewBag.datasource"
                        x-name="xDate"
                        y-name="yValue">
        <e-range-tooltip-settings visible="true" label-format="MMM/yyyy" tooltip-display-mode="always">
        </e-range-tooltip-settings>
</ej-range-navigator>
The following code example illustrates how to use the RangeChanged event of RangeNavigator for updating the chart with the selected data.
<script type="text/javascript" language="javascript">

	function onRangeChanged(sender)
	{

		var chartObj = $("#chartContainer").data("ejChart");

		if (chartObj != null)
		{

			chartObj.model.series[0].dataSource = sender.selectedData;

			$("#chartContainer").ejChart("redraw");

		}

	}

</script>
The following screenshot displays how the RangeNavigator is updated when the selected range is changed.

Set value type
RangeNavigator can also be used with numerical values. You can specify the data type using ValueType option.
First let’s create a DataSource for Chart Series with integer Values.
In Controllers/HomeController.cs specify the data for data source.
public IActionResult Index()
{
var DataSource = GetData();
ViewBag.datasource = DataSource;
return View();
}
public ArrayList GetData()
{
ArrayList dataTable = new ArrayList();
dataTable.Add(new NavigatorData(0, 10));
dataTable.Add(new NavigatorData(50, 5));
dataTable.Add(new NavigatorData(100, 15));
dataTable.Add(new NavigatorData(150, 25));
dataTable.Add(new NavigatorData(200, 10));
dataTable.Add(new NavigatorData(250, 5));
dataTable.Add(new NavigatorData(300, 15));
return dataTable;
}
class NavigatorData
{
public double xValue;
public double yValue;
public NavigatorData(double XValue, double YValue)
{
this.xValue = XValue;
this.yValue = YValue;
}
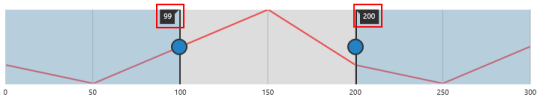
}In SimpleRangeNavigator.cshtml, specify the DataSource to the Series and provide the field name to get the values from the DataSource in XName and YName options series and also set the ValueType property to “numeric” as given in the following code example.
<ej-range-navigator id="scrollcontent" value-type="Numeric">
        <e-chart-series>
            <e-series type="Line" datasource="(System.Collections.IEnumerable)ViewBag.datasource"
                      x-name="xValue" y-name="yValue">
            </e-series>
        </e-chart-series>
</ej-range-navigator>
The following screenshot displays the RangeNavigator with numerical values: