How can I help you?
Data Binding
- Diagram can be populated with the nodes and connectors based on the information provided from an external data source.
- Diagram exposes its specific data-related properties allowing you to specify the data source fields from where the node information has to be retrieved from.
To explore those properties, see Data source settings
- Diagram supports three different kinds of Data binding.
- Local Data
- Remote Data
- HTML Table Data
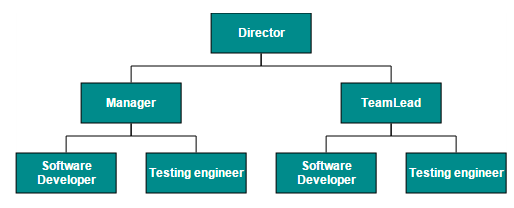
Local Data
Diagram can be populated based on the user defined JSON data (Local Data) by mapping the relevant data source fields.
To map the user defined JSON data with Diagram, you have to configure the fields of dataSourceSettings. The following code example illustrates how to bind local data with the Diagram.
<ej-diagram id="diagramCore"  width="100%" height="490px" [dataSourceSettings]="dataSourceSettings" [layout]="layout" [defaultSettings]="defaultSettings" [nodeTemplate]="nodeTemplate">
</ej-diagram>//Initializes local data
import { Component } from '@angular/core';
@Component({
selector: 'ej-app',
templateUrl: 'app/components/diagram/localdatabinding.component.html',
})
export class LocalDataBindingComponent {
dataSourceSettings: Object;
defaultSettings: Object;
layout: Object;
nodeTemplate: Function;
constructor() {
let data = [
{ "Name": "Director"},
{ "Name": "Manager", "ReportingPerson": "Director"},
{ "Name": "TeamLead", "ReportingPerson": "Director"},
{ "Name": "Software Developer", "ReportingPerson": "TeamLead" },
{ "Name": "Testing engineer", "ReportingPerson": "TeamLead" },
{ "Name": "Software Developer", "ReportingPerson": "Manager" },
{ "Name": "Testing engineer", "ReportingPerson": "Manager" }
];
this.dataSourceSettings = {
// Defines the unique field of each JSON data
id: "Name",
// Defines the parent field which builds the relationship
parent: "ReportingPerson",
//Sets the local data source to the diagram.
dataSource: data
};
this.defaultSettings = {
node: {
width: 100,
height: 40,
fillColor: "darkcyan",
labels: [{ name: "label1", bold: true, fontColor: "white" }]
},
connector: {
segments: [{ type: "orthogonal" }],
targetDecorator: { shape: "none" }
}
};
//Uses layout to auto-arrange nodes on the Diagram page
this.layout = { type: "hierarchicaltree" };
//Binds the JSON(local data) with node
this.nodeTemplate = function (diagram, node) {
// Sets the Name field of JSON data as label.
node.labels[0].text = node.Name;
};
}
}
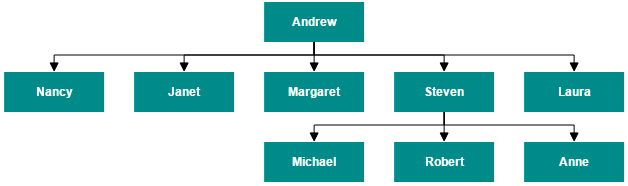
Remote Data
You can bind the Diagram with Remote Data by using dataManager.
- DataManager supports the following types of data-binding: JSON, Web Services, oData.
- It uses two different classes: ej.DataManager for processing and ej.Query for serving data. ej.DataManager communicates with data source and ej.Query generates data queries that are read by the dataManager.
- To learn more, refer to Data Manager.
To bind remote data to the Diagram, you have to configure the fields of dataSourceSettings. The following code illustrates how to bind remote data to the Diagram.
export class LocalDataBindingComponent {
    dataSourceSettings: Object;
    defaultSettings: Object;
    layout: Object;
    nodeTemplate: Function;
    constructor() {
        this.dataSourceSettings= {
            //Initializes the data manager
            dataSource: ej.DataManager({
            // Specifies the remote data service
                    url: "http://mvc.syncfusion.com/Services/Northwnd.svc/"
                }),
            //Defines the query to retrieve data
            query: ej.Query().from("Employees").select("EmployeeID, ReportsTo, FirstName"),
            // Defines the table name
            tableName: "Employees",
            // Defines the unique field
            id: "EmployeeID",
            // Define the field to relate objects
            parent: "ReportsTo"
        };
        this.defaultSettings = {
            node: {
            width: 100,
            height: 40,
            fillColor: "darkcyan",
            labels: [{ name: "label1", bold: true, fontColor: "white" }]
            },
        connector: {
            segments: [{ type: "orthogonal" }],
            targetDecorator: { shape: "none" }
            }
        };
        //Uses layout to auto-arrange nodes on the Diagram page
        this.layout = { type: "hierarchicaltree" };
        //Binds the JSON(local data) with node
        this.nodeTemplate = function (diagram, node) {
            // Sets the Name field of JSON data as label.
        	node.labels[0].text = node.FirstName;
        };
    }
}
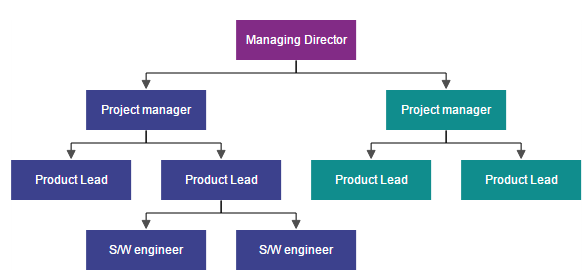
HTML Table Data
The Diagram provides support to populate the Diagram from the HTML table. It is flexible to convert HTML table to Diagram by using Data Manager.
The following code illustrates how to convert HTML table to the Diagram.
<!-- HTML Table -->
<table id="htmlbinding">
    <thead>
        <tr>
            <th>Id</th>
            <th>Designation</th>
            <th>Color</th>
            <th>ReportingPerson</th>
        </tr>
    </thead>
    <tbody>
        <tr>
            <td>parent</td>
            <td>Managing Director</td>
            <td>#822b86</td>
            <td>null</td>
        </tr>
        <tr>
            <td>1</td>
            <td>Project manager</td>
            <td>#3c418d</td>
            <td>parent</td>
        </tr>
        <tr>
            <td>2</td>
            <td>Project manager</td>
            <td>#108d8d</td>
            <td>parent</td>
        </tr>
        <tr>
            <td>3</td>
            <td>Product Lead</td>
            <td>#3c418d</td>
            <td>1</td>
        </tr>
        <tr>
            <td>4</td>
            <td>Product Lead</td>
            <td>#3c418d</td>
            <td>1</td>
        </tr>
        <tr>
            <td>5</td>
            <td>Product Lead</td>
            <td>#108d8d</td>
            <td>2</td>
        </tr>
        <tr>
            <td>6</td>
            <td>Product Lead</td>
            <td>#108d8d</td>
            <td>2</td>
        </tr>
        <tr>
            <td>7</td>
            <td>S/W engineer</td>
            <td>#3c418d</td>
            <td>4</td>
        </tr>
        <tr>
            <td>8</td>
            <td>S/W engineer</td>
            <td>#3c418d</td>
            <td>4</td>
        </tr>
    </tbody>
</table>//Binds custom JSON with node
function nodeTemplate(diagram, node) {
node.labels[0].text = node.Designation;
node.fillColor = node.Color;
}
syncApp.controller('diagramCtrl', function($scope) {
//Uses layout to auto-arrange nodes on the Diagram page
$scope.layout = {
type: "hierarchicaltree"
};
$scope.defaultSettings = {
//Sets the default properties for nodes and connectors.
node: {
width: 120,
height: 40,
shape: "rectangle",
borderColor: "transparent",
labels: [{
name: "label1",
fontColor: "#ffffff"
}]
},
connector: {
segments: [{
"type": "orthogonal"
}],
targetDecorator: {
fillColor: "#4F4F4F",
borderColor: "#4F4F4F"
}
}
};
$scope.nodeTemplate = "nodeTemplate";
//Configures data source
$scope.dataSourceSettings = {
id: "Id",
parent: "ReportingPerson",
//Defines data source with html table
dataSource: ej.DataManager($("#htmlbinding")),
};
});