- Create Connector
- Update Connector at runtime
- Connect nodes
- Segments
- Decorator
- Padding
- Bridging
- Corner radius
- Appearance
- Interaction
- Constraints
Contact Support
Connector support in Angular Diagram
12 Oct 202224 minutes to read
Connectors are objects used to create link between two points, nodes or ports to represent the relationships between them.
Create Connector
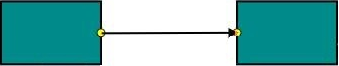
Connector can be created by defining the start and end points. The path to be drawn can be defined with a collection of segments.
To explore the properties of a connector, refer to Connector Properties.
Add connectors through connectors collection
The sourcePoint and targetPoint properties of connector allow you to define the end points of a connector. The following code example illustrates how to add a connector through connector collection.
<div>
    <ej-diagram id="diagramCore" width="100%" height="490px" [connectors]="connectors">
    </ej-diagram>
</div>export class ModelComponent {
connectors: Array<any>;
constructor() {
this.connectors = [{
//Name of the connector
name: "connector",
//Sets source and target points
sourcePoint: {
x: 100,
y: 100
},
targetPoint: {
x: 200,
y: 200
}
}];
}
};
Add connector at run time
Connectors can be added at runtime with the client side method, add. The following code example illustrates how to add connector at runtime.
// Defines JSON
var connector = {
    name: "connector",
    sourcePoint: {
        x: 100,
        y: 100
    },
    targetPoint: {
        x: 200,
        y: 200
    }
};
var diagram = $("#DiagramContent").ejDiagram("instance");
// Adds to the Diagram
diagram.add(connector);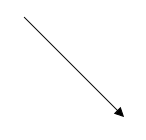
Connectors from palette
Connectors can be predefined and added to the symbol palette. You can drop those connectors into the Diagram, when required.
For more information about adding connectors from symbol palette, refer to Symbol Palette.
Connectors through data source
Connectors are automatically generated based on the relationships defined through the data source.
The default properties for these connectors are fetched from default settings.
For more information about data source, refer to Data Binding.
Draw connectors
Connectors can be interactively drawn by clicking and dragging on the Diagram surface by using DrawingTool. For more information about drawing connectors, refer to Draw Connectors.
Update Connector at runtime
The client side method, updateConnector is used to update the connectors at run time. The following code example illustrates how to update a connector at runtime.
var diagram = $("#DiagramContent").ejDiagram("instance");
diagram.updateConnector("connectorName", {
lineColor: "#1BA0E2",
lineWidth: 5,
lineDashArray: "5,5"
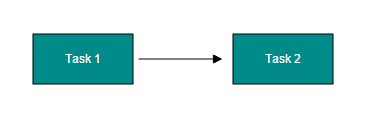
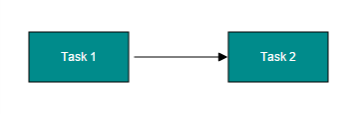
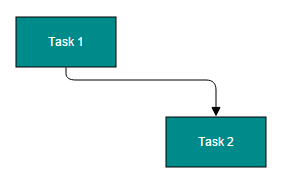
});Connect nodes
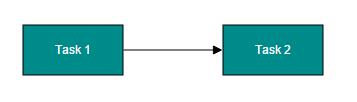
The SourceNode and targetNode properties allow to define the nodes to be connected. The following code example illustrates how to connect two nodes.
<div>
    <ej-diagram id="diagramCore" e-height="500px" e-width="700px" e-nodes="nodes" e-defaultsettings="defaultSettings" e-connectors="connectors">
    </ej-diagram>
</div>export class ConnectorComponent {
nodes: Array<any>;
connectors: Array<any>;
defaultSettings: Object;
constructor() {
this.nodes = [
{
name: "task1",
offsetX: 200,
offsetY: 200,
labels: [{
text: "Task 1"
}]
},
{
name: "task2",
offsetX: 400,
offsetY: 200,
labels: [{
text: "Task 2"
}]
}
];
this.connectors = [
{
//Name of the connector
name: "flow1",
//Name of the source and target nodes
sourceNode: "task1",
targetNode: "task2"
}];
this.defaultSettings = {
//Defines the common values for the nodes
node: {
width: 100,
height: 50,
fillColor: "darkCyan",
borderColor: "black",
type: ej.datavisualization.Diagram.Shapes.Flow,
shape: ej.datavisualization.Diagram.FlowShapes.Process,
labels: [{
fontColor: "white"
}]
}
}
}
}
NOTE
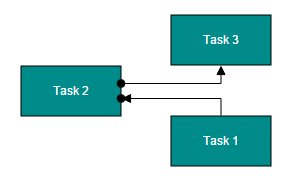
By default, connections are created at the intersecting point of segments and node bounds. The connection between any specific point of source and target nodes can be achieved with connection ports.
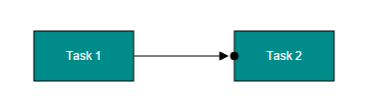
Connections with ports
The sourcePort and targetPort properties allow to create connections between some specific points of source/target nodes.
The following code example illustrates how to create port to port connections.
<div>
    <ej-diagram  id="diagramCore" width="700px" height="500px" [nodes]="nodes" [connectors]="connectors"
    [defaultSettings]="defaultSettings">
    </ej-diagram>
</div>export class NodesComponent {
nodes: Array<any>;
connectors: Array<any>;
constructor() {
this.nodes = [{
name: "task1",
offsetX: 350,
offsetY: 300,
labels: [{ text: "Task 1" }]
}, {
name: "task2",
offsetX: 200,
offsetY: 250,
labels: [{
text: "Task 2"
}],
// Adds ports to node
ports: [{
name: "in",
offset: {
x: 1,
y: 0.65
},
shape: "circle",
visibility: "visible",
fillColor: "black"
}, {
name: "out",
offset: {
x: 1,
y: 0.35
},
shape: "circle",
visibility: "visible",
fillColor: "black"
}]
},{
name: "task3",
offsetX: 350,
offsetY: 200,
labels: [{ text: "Task 3" }]
}];
this.connectors = [{
name: "flow1",
sourceNode: "task1",
targetNode: "task2",
//Name of the target port defined in the target node
targetPort: "in"
}, {
name: "flow2",
sourceNode: "task2",
targetNode: "task3",
//Name of the source port defined in the source node
sourcePort: "out"
}];
//Defines the properties that carry the common values
this.defaultSettings = {
//Defines the common values for the nodes
node: {
width: 100,
height: 50,
fillColor: "darkCyan",
borderColor: "black",
type: ej.datavisualization.Diagram.Shapes.Flow,
shape: ej.datavisualization.Diagram.FlowShapes.Process,
labels: [{
fontColor: "white"
}]
}
//Defines common values for connectors
connector: {
segments: [{
type: "orthogonal"
}]
}
}
}};
Segments
The path of the connector is defined with a collection of segments. There are three types of segments.
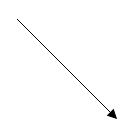
Straight
Straight segment allows to create a straight line.
To create a straight line, you should specify the type of the segment as “straight” and add a straight segment to segments collection. The following code example illustrates how to create a default straight segment.
export class ConnectorComponent {
    connectors: Array<any>;
    constructor() {
        this.connectors = [
            {
                name: "connector",
                sourcePoint: {
                    x: 100,
                    y: 100
                },
                targetPoint: {
                    x: 200,
                    y: 200
                },

                //Defines segment collection
                segments: [{
                    //When there is no previous segment, line starts from source point
                    //When the end point is not specified, line ends at target point
                    //Defines the type of the segment
                    type: "straight"
                }]
            }];
    }
}
The point property of straight segment allows you to define the end point of it. The following code example illustrates how to define the end point of a straight segment.
export class ConnectorComponent {
    connectors: Array<any>;
    constructor() {
        this.connectors = [
            {
                name: "connector",
                sourcePoint: {
                    x: 100,
                    y: 100
                },
                targetPoint: {
                    x: 200,
                    y: 200
                },

                //Defines segment collection
                segments: [{
                    //When there is no previous segment, line starts from source point
                    //When the end point is not specified, line ends at target point
                    //Defines the type of the segment
                    type: "straight",
                    // Defines the end point of the segment
                    point: {
                        x: 100,
                        y: 200
                    }
                }]
            }];
    }
}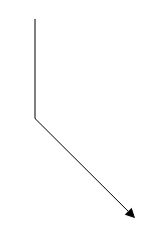
Orthogonal
Orthogonal segments are used to create segments that are perpendicular to each other.
Set the segment type as “orthogonal” to create a default orthogonal segment. The following code example illustrates how to create a default orthogonal segment.
export class ConnectorComponent {
    connectors: Array<any>;
    constructor() {
        this.connectors = [
            {
                name: "connector",
                sourcePoint: {
                    x: 100,
                    y: 100
                },
                targetPoint: {
                    x: 200,
                    y: 200
                },
                //Defines segment collection
                segments: [{
                    // Define the type of the segment
                    type: "orthogonal"
                }]
            }];
    }
}
The length and direction properties allow to define the flow and length of segment. The following code example illustrates how to create customized orthogonal segments.
export class ConnectorComponent {
    connectors: Array<any>;
    constructor() {
        this.connectors = [
            {
                name: "connector",
                sourcePoint: {
                    x: 100,
                    y: 100
                },
                targetPoint: {
                    x: 200,
                    y: 200
                },
                //Defines segment collection
                segments: [{
                    // Define the type of the segment
                    type: "orthogonal",
                    length: 50,
                    direction: "bottom"
                    // Additional orthogonal segments will be added from the end of the last segment to the target point
                }]
            }];
    }
}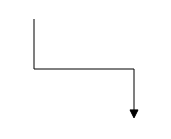
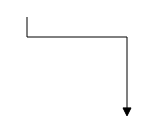
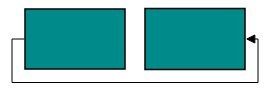
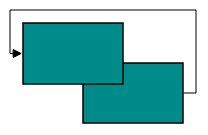
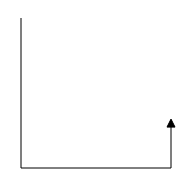
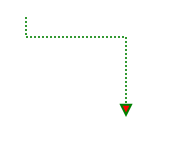
Avoid overlapping
Orthogonal segments are automatically re-routed, in order to avoid overlapping with the source and target nodes. The following images illustrate how orthogonal segments are re-routed.
NOTE
Overlapping with source and target nodes are only avoided. Other nodes are not considered as obstacles.
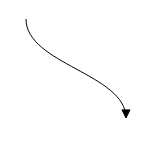
Bezier
Bezier segments are used to create curve segments and the curves are configurable either with the control points or with vectors.
To create a bezier segment, the segment.type is set as bezier. The following code example illustrates how to create a default Bezier segment.
export class ConnectorComponent {
    connectors: Array<any>;
    constructor() {
        this.connectors = [
            {
                name: "connector",
                sourcePoint: {
                    x: 100,
                    y: 100
                },
                targetPoint: {
                    x: 200,
                    y: 200
                },
                //Defines segment collection
                segments: [{
                    // Define the type of the segment
                    type: "bezier"
                }]
            }];
    }
}
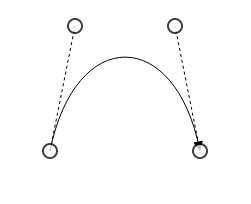
The point1 and point2 properties of bezier segment enable you to set the control points. The following code example illustrates how to configure the Bezier segments with control points.
export class ConnectorComponent {
    connectors: Array<any>;
    constructor() {
        this.connectors = [
            {
                name: "connector",
                sourcePoint: {
                    x: 100,
                    y: 100
                },
                targetPoint: {
                    x: 200,
                    y: 200
                },
                //Defines segment collection
                segments: [{
                // Defines the type of the segment
                type: "bezier",
                // First control point: an absolute position from the page origin
                point1: {
                    x: 125,
                    y: 75
                },
                // Second control point: an absolute position from the page origin
                point2: {
                    x: 225,
                    y: 75
                }
            }]
        }];
    }
}
The vactor1 and vector2 properties of bezier segment enable you to define the vectors. The following code illustrates how to configure a bezier curve with vectors.
export class ConnectorComponent {
    connectors: Array<any>;
    constructor() {
        this.connectors = [
            {
                name: "connector",
                sourcePoint: {
                    x: 100,
                    y: 100
                },
                targetPoint: {
                    x: 200,
                    y: 200
                },
                //Defines segment collection
                segments: [{
                // Defines the type of the segment
                type: "bezier",
                // Length and angle between the source point and the first control point
                vector1: {
                    angle: 270,
                    distance: 75
                },
                // Length and angle between the target point and the second control point
                vector2: {
                    angle: 270,
                    distance: 75
                }
            }]
        }];
    }
}
Complex segments
Multiple segments can be defined one after another. To create a connector with multiple segments, define and add the segments to connector.segments collection. The Following code example illustrates how to create a connector with multiple segments.
export class ConnectorComponent {
    connectors: Array<any>;
    constructor() {
        this.connectors = [
            {
                name: "connector",
                sourcePoint: {
                    x: 100,
                    y: 100
                },
                targetPoint: {
                    x: 200,
                    y: 200
                },
                //Defines segment collection
                segments: [{
                    // Segment of length 100px to the bottom
                    type: "orthogonal",
                    length: 150,
                    direction: "bottom"
                }, {
                    //Defines a segment of 150px length to the right
                    type: "orthogonal",
                    direction: "right",
                    length: 150
                }
                //Additional orthogonal segments will be added from the end of the last segment to the target point
                ]
        }];
    }
}
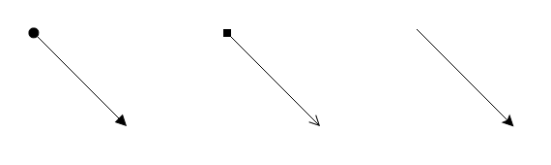
Decorator
Start and end points of a connector can be decorated with some customizable shapes like arrows, circles, diamond or path. You can decorate the connection end points with the sourceDecorator and targetDecorator properties of connector.
To explore the properties of decorators, refer to Decorator Properties.
The shape property of decorator allows to define the shape of the decorators. The following code example illustrates how to create decorators of various shapes.
export class ConnectorComponent {
    connectors: Array<any>;
    constructor() {
        this.connectors = [
            {
                name: "connector",
                sourcePoint: {
                    x: 100,
                    y: 100
                },
                targetPoint: {
                    x: 200,
                    y: 200
                },
                // Decorator shape- circle
                sourceDecorator: {
                    shape: ej.datavisualization.Diagram.DecoratorShapes.Circle,
                    width: 10,
                    height: 10
                },
                // Decorator shape - Arrow
                targetDecorator: {
                    shape: ej.datavisualization.Diagram.DecoratorShapes.Arrow,
                    width: 10,
                    height: 10
                }
            },{
                name: "connector2",
                sourcePoint: {
                    x: 300,
                    y: 100
                },
                targetPoint: {
                    x: 400,
                    y: 200
                },
                // Decorator shape - Open arrow
                sourceDecorator: {
                    shape: ej.datavisualization.Diagram.DecoratorShapes.Diamond,
                    width: 10,
                    height: 10
                },
                // Decorator shape - Diamond
                targetDecorator: {
                    shape: ej.datavisualization.Diagram.DecoratorShapes.OpenArrow,
                    width: 10,
                    height: 10
                }
            },{
                name: "connector3",
                sourcePoint: {
                    x: 500,
                    y: 100
                },
                targetPoint: {
                    x: 600,
                    y: 200
                },

                // Decorator shape - Path
                targetDecorator: {
                    shape: ej.datavisualization.Diagram.DecoratorShapes.Path,
                    pathData: "M 376.892,225.284L 371.279,211.95L 376.892,198.617L 350.225,211.95L 376.892,225.284 Z"
                }
            }];
    }
}
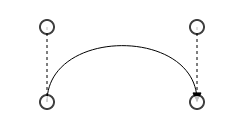
Padding
Padding is used to leave space between the Connector’s end point and the object to where it is connected.
The sourcePadding and targetPadding properties of connector define the space to be left between the connection end points and the source and target nodes of connector. The following code example illustrates how to leave space between the connection end points and source, target nodes.
export class ConnectorComponent {
    connectors: Array<any>;
    nodes: Array<any>;
    constructor() {
        this.nodes = [{
            name: "task1",
            offsetX: 200,
            offsetY: 200,
            labels: [{
                text: "Task 1"
            }]
        },{
            name: "task2",
            offsetX: 400,
            offsetY: 200,
            labels: [{
                text: "Task 2"
            }]
        }];
        this.connectors = [
            {
                name: "connector",
                sourceNode: "task1",
                targetNode: "task2",
                // Space between source point and source object
                sourcePadding: 5,
                // Space between target point and target object
                targetPadding: 10
            }
        ];
    }
}
The connectorPadding property of node defines the space to be left between the node bounds and its edges. The following code example illustrates how to leave the space between a node and its connections.
export class ConnectorComponent {
    connectors: Array<any>;
    nodes: Array<any>;
    constructor() {
        this.nodes = [{
            name: "task1",
            offsetX: 200,
            offsetY: 200,
            labels: [{
                text: "Task 1"
            }],
            //Space between the node and its edges
            connectorPadding: 5
        },{
            name: "task2",
            offsetX: 400,
            offsetY: 200,
            labels: [{
                text: "Task 2"
            }]
        }];
        this.connectors = [
            {
                name: "connector",
                sourceNode: "task1",
                targetNode: "task2",
            }
        ];
    }
}
The connectorPadding property of port defines the space between the ports and its in/out edges. The following code example illustrates how to leave the space between ports and its connections.
export class ConnectorComponent {
    connectors: Array<any>;
    nodes: Array<any>;
    constructor() {
        this.nodes = [{
            name: "task1",
            offsetX: 200,
            offsetY: 200,
            labels: [{
                text: "Task 1"
            }],
            //Space between the node and its edges
            connectorPadding: 5
        },{
            name: "task2",
            offsetX: 400,
            offsetY: 200,
            labels: [{
                text: "Task 2"
            }],
            ports:[{
                name: "port",
                offset: {
                    x: 0,
                    y: 0.5
                },
                shape: "circle",
                visibility: "visible",
                fillColor: "black",
                //Space between port and its edges
                connectorPadding: 5
            }]
        }];
        this.connectors = [
            {
                name: "connector",
                sourceNode: "task1",
                targetNode: "task2",
                targetPort: "port"
            }
        ];
    }
}
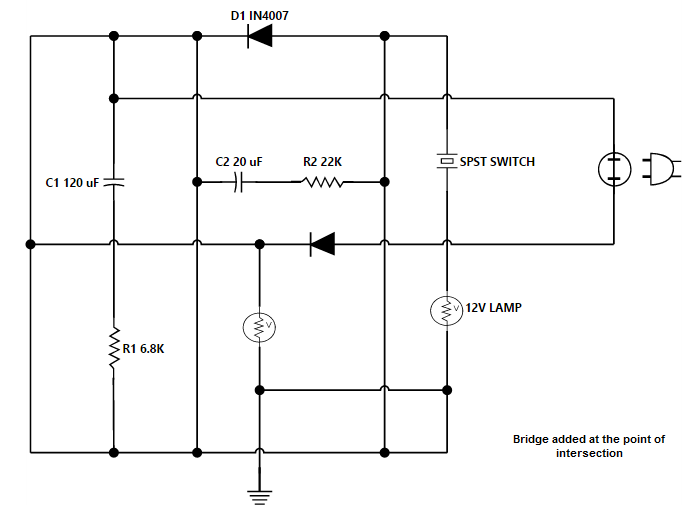
Bridging
Line Bridging creates a bridge for lines to smartly cross over other lines, at points of intersection. When two line connectors meet each other, the line with the higher z-order (upper one) draws an arc over the underlying connector.
Bridging can be enabled/disabled either with the connector.constraints or diagram.constraints. The following code example illustrates how to enable line bridging.
<div>
    <ej-diagram id="diagram" height="500px" width="100%" [connectors]="connectors" [constraints]="constraints">
    </ej-diagram>
</div>export class ConnectorComponent {
connectors: Array<any>;
constructor() {
this.connectors = [
{
name: "connector",
sourcePoint: {
x: 100,
y: 100
},
targetPoint: {
x: 200,
y: 200
},
constraints: ej.datavisualization.Diagram.ConnectorConstraints.Default
// Removes inherit bridging or else bridging is enabled/disabled based on the Diagram constraints
&
~ej.datavisualization.Diagram.ConnectorConstraints.InheritBridging
//Includes bridging
|
ej.datavisualization.Diagram.ConnectorConstraints.Bridging
};
this.constraints: ej.datavisualization.Diagram.DiagramConstraints.Default |
ej.datavisualization.Diagram.DiagramConstraints.Bridging
}
}
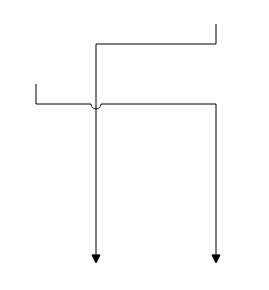
The direction of the bridge can be customized with the property bridgeDirection. BridgeDirection defines the intersecting segment where the bridge has to be inserted. By default, the bridge direction points to the top.
To explore the bridge directions, refer to Bridge Directions.
The following code example illustrates how to draw the bridge at the bottom direction.
export class ConnectorComponent {
    connectors: Array<any>;
    constructor() {
        this.connectors = [
            {
                name: "connector",
                sourcePoint: {
                    x: 100,
                    y: 100
                },
                targetPoint: {
                    x: 200,
                    y: 200
                },
                //Sets the bridge direction
                bridgeDirection: "bottom",
                constraints: ej.datavisualization.Diagram.ConnectorConstraints.Default | ej.datavisualization.Diagram.ConnectorConstraints.Bridging
        }];
      }
}
Limitation: Bezier segments do not support bridging.
Corner radius
Corner radius allows to create connectors with rounded corners. The radius of the rounded corner is set with cornerRadius property.
export class ConnectorComponent {
    connectors: Array<any>;
    nodes: Array<any>;
    constructor() {
        this.nodes = [{
            name: "task1",
            offsetX: 200,
            offsetY: 200,
            labels: [{
                text: "Task 1"
            }],
            //Space between the node and its edges
            connectorPadding: 5
        },{
            name: "task2",
            offsetX: 400,
            offsetY: 200,
            labels: [{
                text: "Task 2"
            }],
            ports:[{
                name: "port",
                offset: {
                    x: 0,
                    y: 0.5
                },
                shape: "circle",
                visibility: "visible",
                fillColor: "black",
                //Space between port and its edges
                connectorPadding: 5
            }]
        }];
        this.connectors = [
            {
                name: "connector",
                sourceNode: "task1",
                targetNode: "task2",
                //Sets the radius for the rounded corner
                cornerRadius: 10
            }
        ];
    }
}
Appearance
Stroke width, stroke color, and style of the lines and decorators can be customized with a set of defined properties.
Segment Appearance
The following code example illustrates how to customize the segment appearance.
export class ConnectorComponent {
    connectors: Array<any>;
    constructor() {
        this.connectors = [
            {
                name: "connector",
                sourcePoint: {
                    x: 100,
                    y: 100
                },
                targetPoint: {
                    x: 200,
                    y: 200
                },
                //Stroke width of the line
                lineWidth: 2,
                //Stroke color
                lineColor: "green",
                //Line style
                lineDashArray: "2,2",
                //Opacity of the line
                opacity: 0.8
            }];
    }
}
Decorator Appearance
The following code example illustrates how to customize the appearance of the decorator.
export class ConnectorComponent {
    connectors: Array<any>;
    constructor() {
        this.connectors = [
            {
                name: "connector",
                sourcePoint: {
                    x: 100,
                    y: 100
                },
                targetPoint: {
                    x: 200,
                    y: 200
                },
                //Defines the shape
                targetDecorator:{
                shape: ej.datavisualization.Diagram.DecoratorShapes.Arrow,
                //Fills color of the decorator
                fillColor: "red",
                //Stroke color
                borderColor: "green",
                //Stroke width
                borderWidth: 2,
                width: 10,
                height: 10
            }];
    }
}
Interaction
Diagram allows to edit the connectors at runtime. To edit the connector segments at runtime, refer to Connection Editing.
Constraints
The constraints property of connector allows to enable/disable certain features of connectors. For more information about constraints, refer to Connector Constraints.