Data Labels in .NET MAUI Pyramid Chart
8 Jul 20264 minutes to read
Data labels are used to display values related to a chart segment. Values from data points (x, y) or other custom properties from a data source can be displayed.
NOTE
Prerequisite: Ensure that the required NuGet package is installed, the necessary namespaces are imported, and the Pyramid Chart control is properly configured in your application. For detailed setup and configuration instructions, refer to the Getting Started guide.
Enable data labels
To enable data labels in the chart, set the ShowDataLabels property to true. The default value is false. By default, the Y-value of each data point is displayed in the label.
<chart:SfPyramidChart ItemsSource="{Binding Data}"
                      XBindingPath="XValue"
                      YBindingPath="YValue"
                      ShowDataLabels="True">
</chart:SfPyramidChart>
SfPyramidChart chart = new SfPyramidChart()
{
ItemsSource = new ViewModel().Data,
XBindingPath = "XValue",
YBindingPath = "YValue",
ShowDataLabels = true
};
this.Content = chart;Customize data labels
Data labels can be customized using the DataLabelSettings property of the chart. To customize data labels, create an instance of PyramidDataLabelSettings and assign it to the DataLabelSettings property.
Data label settings
The following properties in PyramidDataLabelSettings are used to customize data labels:
-
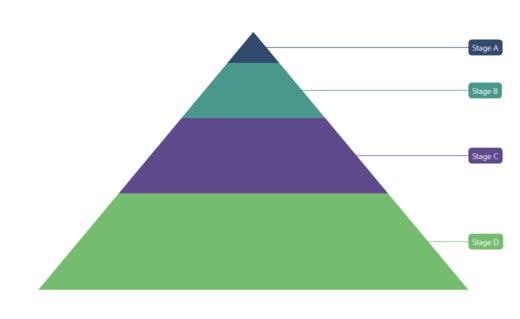
LabelPlacement— Positions the pyramid chart data labels at Auto, Inner, Center, or Outer. Default value isAuto. -
UseSeriesPalette— Sets the chart segment color as the data label background color. -
Context— Gets or sets the content to be displayed in the label using the PyramidDataLabelContext enum. Supported values areXValueandYValue. -
LabelStyle— Customizes the appearance of the data labels. Properties available in the ChartDataLabelStyle class include:-
Margin — Gets or sets the label margin (type:
Thickness). -
Background — Gets or sets the label background color (type:
Brush). -
FontAttributes — Gets or sets the font style (type:
FontAttributes). -
FontSize — Gets or sets the font size (type:
double). -
Stroke — Gets or sets the border color (type:
Brush). -
StrokeWidth — Gets or sets the border width (type:
double). -
CornerRadius — Gets or sets the rounded corners for the label (type:
CornerRadius). -
TextColor — Gets or sets the label text color (type:
Color).
-
Margin — Gets or sets the label margin (type:
<chart:SfPyramidChart ItemsSource="{Binding Data}"
                      XBindingPath="XValue"
                      YBindingPath="YValue"
                      ShowDataLabels="True">
    <chart:SfPyramidChart.DataLabelSettings>
        <chart:PyramidDataLabelSettings LabelPlacement="Outer"
                                        Context="XValue"
                                        UseSeriesPalette="True">
            <chart:PyramidDataLabelSettings.LabelStyle>
                <chart:ChartDataLabelStyle Margin="2"/>
            </chart:PyramidDataLabelSettings.LabelStyle>
        </chart:PyramidDataLabelSettings>
    </chart:SfPyramidChart.DataLabelSettings>
</chart:SfPyramidChart>
SfPyramidChart chart = new SfPyramidChart()
{
ItemsSource = new ViewModel().Data,
XBindingPath = "XValue",
YBindingPath = "YValue",
ShowDataLabels = true
};
ChartDataLabelStyle labelStyle = new ChartDataLabelStyle()
{
Margin = 2
};
chart.DataLabelSettings = new PyramidDataLabelSettings()
{
Context = PyramidDataLabelContext.XValue,
LabelPlacement = DataLabelPlacement.Outer,
UseSeriesPalette = true,
LabelStyle = labelStyle
};
this.Content = chart;