Polar Area Chart in .NET MAUI Polar Chart
15 Jul 20269 minutes to read
Polar Area Chart
To display an area series in a polar chart, instantiate the PolarAreaSeries and include it in the Series collection property of SfPolarChart.
NOTE
Prerequisite: Ensure that the required NuGet package is installed, the necessary namespaces are imported, and the SfPolarChart control is properly configured in your application. For detailed setup and configuration instructions, refer to the Getting Started guide.
<chart:SfPolarChart>
    <chart:SfPolarChart.PrimaryAxis>
        <chart:CategoryAxis/>
    </chart:SfPolarChart.PrimaryAxis>

    <chart:SfPolarChart.SecondaryAxis>
        <chart:NumericalAxis/>
    </chart:SfPolarChart.SecondaryAxis>

    <chart:PolarAreaSeries ItemsSource = "{Binding PlantDetails}"
                           XBindingPath = "Direction"
                           YBindingPath = "Tree"/>
</chart:SfPolarChart>
SfPolarChart chart = new SfPolarChart();
CategoryAxis primaryAxis = new CategoryAxis();
chart.PrimaryAxis = primaryAxis;
NumericalAxis secondaryAxis = new NumericalAxis();
chart.SecondaryAxis = secondaryAxis;
PolarAreaSeries series = new PolarAreaSeries()
{
ItemsSource = new PlantViewModel().PlantDetails,
XBindingPath = "Direction",
YBindingPath = "Tree"
};
chart.Series.Add(series);
this.Content = chart;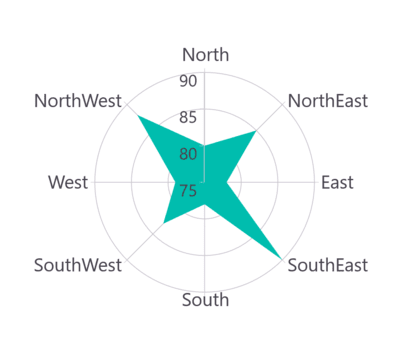
Grid line Type
The GridLineType property customizes the rendering style of axis grid lines:
- Circle (default) — Renders concentric circular grid lines, creating a target-like appearance
- Polygon — Renders polygonal grid lines, creating a web or spider chart appearance
<chart:SfPolarChart GridLineType= "Polygon">
    <!-- code omitted for brevity -->
    <chart:PolarAreaSeries ItemsSource = "{Binding PlantDetails}"
                           XBindingPath = "Direction"
                           YBindingPath = "Tree"/>
</chart:SfPolarChart>
SfPolarChart chart = new SfPolarChart();
chart.GridLineType = PolarChartGridLineType.Polygon;
// code omitted for brevity
PolarAreaSeries series = new PolarAreaSeries()
{
ItemsSource = new PlantViewModel().PlantDetails,
XBindingPath = "Direction",
YBindingPath = "Tree"
};
chart.Series.Add(series);
this.Content = chart;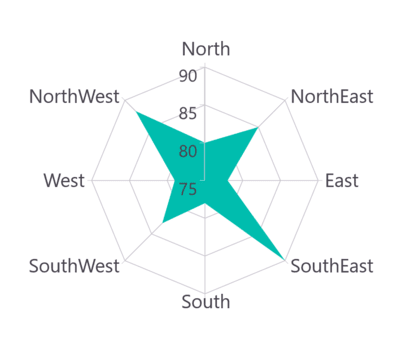
Closed Series
The IsClosed property is used to render the series with or without a closed path. The default value is true, which creates a closed polygon shape. Set to false to create an open path that doesn’t connect the last point to the first.
Note: Negative Y values are not recommended for polar area charts as they may produce unexpected visualizations. Ensure all Y values are non-negative for optimal results.
<chart:SfPolarChart>
    <!-- code omitted for brevity -->
    <chart:PolarAreaSeries ItemsSource = "{Binding PlantDetails}"
                           XBindingPath = "Direction"
                           YBindingPath = "Tree"
                           IsClosed = "False"/>
</chart:SfPolarChart>
SfPolarChart chart = new SfPolarChart();
// code omitted for brevity
PolarAreaSeries series = new PolarAreaSeries()
{
ItemsSource = new PlantViewModel().PlantDetails,
XBindingPath = "Direction",
YBindingPath = "Tree",
IsClosed = false
};
chart.Series.Add(series);
this.Content = chart;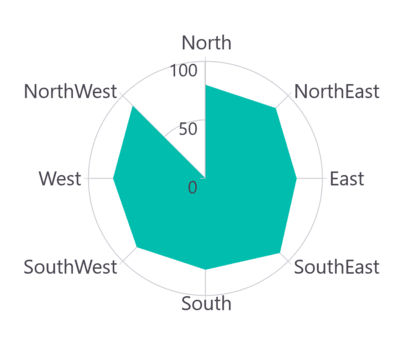
Enable Marker
A marker, also known as a symbol, is used to determine or highlight the position of the data point. To enable markers in the series, set the ShowMarkers property to true.
<chart:SfPolarChart>
    <!-- code omitted for brevity -->
    <chart:PolarAreaSeries ItemsSource = "{Binding PlantDetails}"
                           XBindingPath = "Direction"
                           YBindingPath = "Tree"
                           ShowMarkers = "True"/>
</chart:SfPolarChart>
SfPolarChart chart = new SfPolarChart();
// code omitted for brevity
PolarAreaSeries series = new PolarAreaSeries()
{
ItemsSource = new PlantViewModel().PlantDetails,
XBindingPath = "Direction",
YBindingPath = "Tree",
ShowMarkers= true
};
chart.Series.Add(series);
this.Content= chart;Marker customization
In order to change the series markers appearance, create an instance of the MarkerSettings property. The following properties are used to customize marker appearance.
-
Type, of type
ShapeType, describes the shape of the series marker. The default value of this property isShapeType.Circle. -
Stroke, of type
Brush, indicates the brush used to paint the marker border. -
StrokeWidth, of type
double, indicates the width of the marker border. -
Fill, of type
Brush, indicates the color of the marker. -
Width, of type
double, indicates the width of the marker. -
Height, of type
double, indicates the height of the marker.
<chart:SfPolarChart>
    <!-- code omitted for brevity -->
    <chart:PolarAreaSeries ItemsSource = "{Binding PlantDetails}"
                           XBindingPath = "Direction"
                           YBindingPath = "Tree"
                           ShowMarkers = "True">
        <chart:PolarAreaSeries.MarkerSettings>
            <chart:ChartMarkerSettings Type = "Diamond"
                                       Fill = "Brown"
                                       Stroke = "Black"
                                       StrokeWidth = "1"
                                       Height = "8"
                                       Width = "8"/>
        </chart:PolarAreaSeries.MarkerSettings>
    </chart:PolarAreaSeries>
</chart:SfPolarChart>
SfPolarChart chart = new SfPolarChart();
// code omitted for brevity
ChartMarkerSettings chartMarker = new ChartMarkerSettings()
{
Type = ShapeType.Diamond,
Fill = Colors.Brown,
Stroke = Colors.Black,
StrokeWidth = 1,
Height = 8,
Width = 8
};
PolarAreaSeries series = new PolarAreaSeries()
{
ItemsSource = new PlantViewModel().PlantDetails,
XBindingPath = "Direction",
YBindingPath = "Tree",
ShowMarkers = true,
MarkerSettings = chartMarker
};
chart.Series.Add(series);
this.Content = chart;