Getting Started
9 Jan 201812 minutes to read
-
This section encompasses on how to configure Digital Gauge. You can provide your own data for a Digital Gauge and make them to display in a required way.
-
You can also customize the default Digital Gauge appearance. As a result, Digital Gauge looks like a Digital thermometer.
-
Digital gauge is used in advertisement, decorative purpose, displaying share details in share market, game score boards, token systems, etc.
Create a Digital Gauge
First create an HTML file and then add references to the required libraries.
<!DOCTYPE html>
<html xmlns="http://www.w3.org/1999/xhtml">
<head>
    <meta name="viewport" content="width=device-width, initial-scale=1.0" />
    <meta charset="utf-8" />
    <link href="http://cdn.syncfusion.com/32.1.19/js/web/flat-azure/ej.web.all.min.css" rel="stylesheet" />
    <!--scripts-->
    <script src="http://cdn.syncfusion.com/js/assets/external/jquery-1.10.2.min.js"></script>
    <script src="http://cdn.syncfusion.com/32.1.19/js/web/ej.web.all.min.js"></script>
</head>
Now add a <div> element that acts as a container for ejDigitalGauge widget.
<body>
    <div id="DigitalGauge1"></div>
</body>
</html>
Once the container is added, create the ejDigitalGauge widget as follows,
$(function () {
        $("#DigitalGauge1").ejDigitalGauge();
    });
On executing the above code, sample renders a default Digital Gauge with default values as follows.

Set Height and Width values
Basic attributes of each canvas elements are height and width. You can set the height and width of the gauge.
$(function () {
        $("#DigitalGauge1").ejDigitalGauge({
            height: 145,
            width: 260,
        });
    });
On executing the above code, sample renders a default Digital Gauge with the specified height and width values.

Set Items Property
You can customize the Digital Gauge using different properties.
Add Segment and Character Properties
-
In this example, the Digital Gauge uses a welcome board in which the text color must be distinctly visible in nature. In order to meet this requirement, you can give some
segmentproperties such assegmentspacing, segment width, segment color, segment length and segment opacity. -
Character
typeis used to define the Digital representation of the character. Thee five types of character representation are as follows:-
EightCrossEightDotMatrix
-
SevenSegment
-
FourteenSegment
-
SixteenSegment
-
EightCrossEightSquareMatrix.
-
$(function () {
$("#DigitalGauge1").ejDigitalGauge({
height: 145,
width: 260,
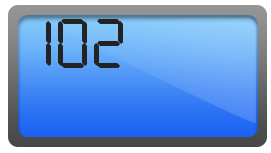
items: [{
segmentSettings: { width: 2, length: 20 },
characterSettings: { type: "sevensegment", spacing: 12, },
value: "102",
}]
});
});On executing the above code, sample renders a Digital Gauge with default values as follows.

Add Background Image
You can add a <div> element to set the background for the Digital Gauge and attach the styles to the HTML page such as height , width, background image URL ,background repeat property, etc.In the following code example, image used is a road in California. You can pass the text as “WELCOME TO CALIFORNIA”
<div id="frameDiv">
    <div id="DigitalGauge1" style="width: 100%">
    </div>
</div>#frameDiv {
align: center;
position: relative;
margin: 0px auto;
display: table;
background-image: url("script/frame.png");
background-repeat: no-repeat;
}On executing the above code, sample renders a default Digital Gauge as follows.
Add Location
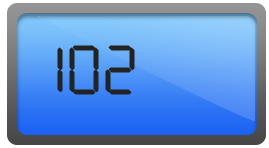
You can position the digital letters inside the canvas element using position property.
$(function () {
        $("#DigitalGauge1").ejDigitalGauge({
            height: 145,
            width: 260,
            items: [{
                //For Displaying Fahrenheit value
                segmentSettings: { width: 2, length: 20 },
                characterSettings: { type: "sevensegment", spacing: 12, },
                value: "102", position: { x: 15, y: 40 }
            }]
        });
    });
On executing the above code, sample renders a default Digital Gauge as follows.
Add Items collection
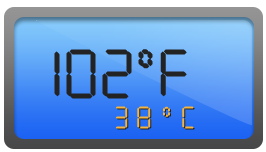
You can add Items collection to display the temperature value as used in the Digital thermometer.
$(function () {
        $("#DigitalGauge1").ejDigitalGauge({
            height: 145, width: 260,
            items: [{
                //For Displaying Fahrenheit value
                segmentSettings: { width: 2, length: 20, spacing: 0 },
                characterSettings: { type: "sevensegment", spacing: 12, },
                value: "102",
                position: { x: 15, y: 40 }
            },
            {
                //For displaying degree symbol
                segmentSettings: { width: 2, length: 5, spacing: 0 },
                characterSettings: { type: "sevensegment", spacing: 5, },
                value: "0",
                position: { x: 70, y: 28 }
            },
            {
                //For Displaying Fahrenheit symbol
                segmentSettings: { width: 2, length: 20, spacing: 0 },
                characterSettings: { type: "sevensegment", spacing: 12, },
                value: "F",
                position: { x: 170, y: 40 }
            },
            {
                //For displaying Celsius value
                segmentSettings: { width: 1, length: 9, spacing: 0, color: "#F5b43f" },
                characterSettings: { type: "sevensegment", spacing: 12, },
                value: "38",
                position: { x: 70, y: 90 },
            },
            {
                //For displaying degree symbol
                segmentSettings: { width: 1, length: 3, spacing: 0, color: "#F5b43f" },
                characterSettings: { type: "sevensegment", spacing: 12, },
                value: "0",
                position: { x: 90, y: 80 }
            },
            {
                //For displaying Celsius symbol
                segmentSettings: { width: 1, length: 9, spacing: 0, color: "#F5b43f" },
                characterSettings: { type: "sevensegment", spacing: 12, },
                value: "c",
                position: { x: 120, y: 90 }
            }]
        });
    });
The following screenshot displays a Digital Gauge with all the customizations discussed earlier.
