Contents
- Tooltip
- Tooltip Template
Having trouble getting help?
Contact Support
Contact Support
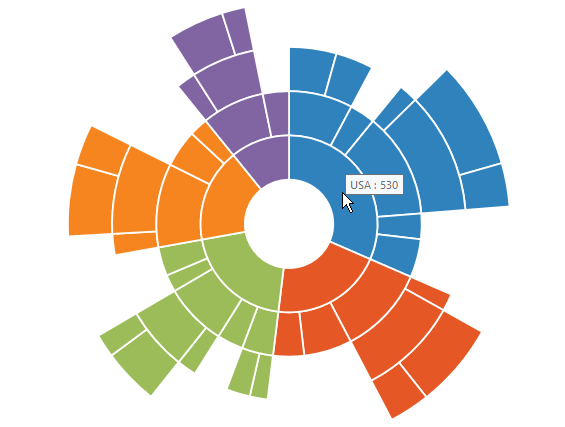
Tooltip
ToolTip allows you to display any information over a sunburst segment. It appears when mouse hovered over or touch any chart segment. By default, it displays the corresponding segment category name and its value
@(Html.EJ().SunburstChart("chartContainer")

      .Tooltip(tooltip => tooltip.Visible(true))
 )
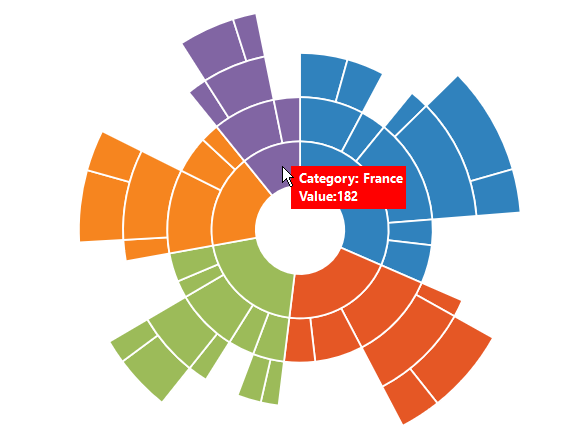
Tooltip Template
HTML elements can be displayed in the tooltip by using the Template property of the tooltip. The template property takes the value of the id attribute of the HTML element. You can use the #point.x# and #point.y# as place holders in the HTML element to display the x and y values of the corresponding point.
<div id="Tooltip" style="display: none;">
<div id="value" style="background-color:red;padding-top:3px;padding-right:3px">
<div>
<label id="efpercentage" style="color:white">
Category: #point.x#
<br /> Value:#point.y#
</label>
</div>
</div>
</div>
@(Html.EJ().SunburstChart("chartContainer")
.Tooltip(tooltip => tooltip.Visible(true).Template("Tooltip"))
)