Bullet Graph Caption
22 Feb 20185 minutes to read
Bullet Graph supports title and subtitle to convey what is represented in Bullet Graph. They are customized using CaptionSettings property.
Title
Title is set to Bullet Graph using Text property in CaptionSettings. Caption settings also include properties like Location, Font, and TextAngle for customizing the caption of Bullet Graph.
Location
Using location option, you can set the X and Y position of caption text.
Font
Using font property, you can customize font color, font family, font style, font weight, opacity, size options.
@(Html.EJ().BulletGraph("Bullets").QuantitativeScaleSettings( scale=>

		scale.Location( loc=> loc.x(110).y(200))

		.Minimum(0)

		.Maximum(5)

		.Interval(1)

		.FeatureMeasure(measure=>measure.Value(4).ComparativeMeasureValue(3.5)))

	    .Height(700)

	    .Width(600)

	    .CaptionSettings(cs=>

	    cs.Text("Revenue YTD")

	    .Location(loc=>loc.y(220))

	    .Font(font=>font.FontStyle("bold").FontColor(System.Drawing.Color.Gray).FontSize("14px")))

  )
The following screenshot displays a Bullet Graph with customized caption using the above code
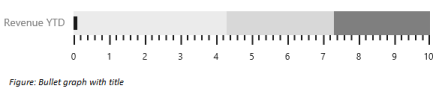
Bullet Graph with title
Subtitle
Subtitle is added to Bullet Graph using Text property of Subtitle in CaptionSettings. Subtitle also provides properties like Location, TextAngle and Font to customize subtitle similar to caption.
Location
Using location option, you can set the X and Y position of caption text.
Font
Using font property, you can customize font color, font family, font style, font weight, opacity, size options.
@(Html.EJ().BulletGraph("Bullets").QuantitativeScaleSettings( scale=>

	scale.Location( loc=> loc.x(110).y(200))

	.Minimum(0)

	.Maximum(5)

	.Interval(1)

	.FeatureMeasure(measure=>measure.Value(4).ComparativeMeasureValue(3.5)))

	.Height(700)

	.Width(600)

	.CaptionSettings(cs=>

	cs.SubTitle(subtitle=>

	subtitle.Text("Subtitle")

	.Location(loc=>loc.x(20).y(225))

	.Font(font=>font.FontStyle("italic").FontSize("16px")))

	.Text("Revenue YTD")

	.Location(loc=>loc.y(210))

	.Font(font=>font.FontStyle("bold").FontColor(System.Drawing.Color.Gray).FontSize("14px")))

	)
The following screenshot displays Bullet Graph with a subtitle
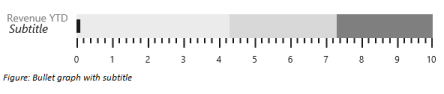
Bullet Graph with subtitle
Indicator
You can add Indicator to bullet graph by enabling Visible and setting Text properties of Indicator in CaptionSettings. Indicator is used to represent whether target is achieved or not with text and symbol by comparing current and target values in bullet graph.
Indicator displays a symbol along with text which is different from caption and subtitle. Images like logos can be used in indicator instead of symbols. Indicator has properties such as Symbol, Text, TextSpacing, TextAngle, Location and Font.
Location
Using location option, you can set the X and Y position of caption text.
Font
Using font property, you can customize font color, font family, font style, font weight, opacity, size options.
Symbol
-
Using
symbolsettings, you can customize the following symbol properties.-
You can customize the symbol border properties border
colorand borderwidthusing border
settings. -
You can specify the color of the symbol using
colorproperty. -
You can set the
shapeof the symbol using shape property. -
Instead of setting shape for symbol, you can use image also. To use image as symbol, you need to set
image urlfor symbol. -
You can customize the size of the indicator symbol using
widthandheightproperties of
indicator’s symbol size settings. -
To customize the
opacityof the indicator symbol, you can use the opacity property of the
symbol.
-
@(Html.EJ().BulletGraph("Bullets").QuantitativeScaleSettings( scale=>

	scale.Location( loc=> loc.x(110).y(200))

	.Minimum(0)

	.Maximum(5)

	.Interval(1)

	.LabelSettings(ls=>ls.LabelPrefix("$").LabelSuffix("K"))

	.FeatureMeasure(measure=>measure.Value(4).ComparativeMeasureValue(3.5)))

	.Height(700)

	.Width(600)

	.CaptionSettings(cs=>

	cs.Indicator(indicator=>

	indicator.Visible(true)

	.Text("+ $0.5 K")

	.Location(loc=>loc.x(15).y(240))

	.Symbol(symbol=>

	  symbol.Shape(SymbolShape.Triangle)

	  .Color("green")

	  .Border(border=>border.Width(1).Color("green")

	  )))


	.SubTitle(subtitle=>

	subtitle.Text("Subtitle")

	.Location(loc=>loc.x(20).y(225))

	.Font(font=>font.FontStyle("italic").FontSize("16px")))

	.Text("Revenue YTD")

	.Location(loc=>loc.y(210))

	.Font(font=>font.FontStyle("bold").FontColor(System.Drawing.Color.Gray).FontSize("14px")))

	)
The following screenshot displays a bullet graph with indicator.
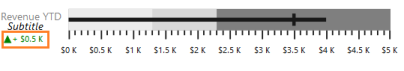
Bullet Graph with indicator
Trim
The title, subtitle and indicator text can be overlapped to the scale group. You can avoid the overlapped text by using the EnableTrim property of the CaptionSettings. The default value of the EnableTrim is true.
@(Html.EJ().BulletGraph("BulletGraph1")

.CaptionSettings(title=>title.Text("Bullet Graph Title").EnableTrim (true))

)
The following screenshot displays the BulletGraph with Trim.
BulletGraph with trim
Text Placement
All the caption group elements (caption, subtitle, and indicator) in the Bullet Graph support text positioning by using the property TextPosition available in all caption group elements. The properties, TextAlignment and TextAnchor are used to customize text placement further.
Text Position
The property TextPosition, is used to position the text at the top, bottom, left, and right side of the quantitative scale. The default value of this property is Float. By default, text can be placed at any desired location by using the Location property.
@(Html.EJ().BulletGraph("BulletGraph1").Width(650).Height(150).Value(8).ComparativeMeasureValue(5)

    .CaptionSettings(title=>title.Text("Bullet Graph Title")

	.TextPosition(BulletTextPosition.Top)

	.Font(font=>

	font.FontSize("20px")

	.FontWeight("bold")

	))

    .QuantitativeScaleSettings(scale=>scale.Location(loc=>loc.x(120).y(40)))

)
The following screenshot displays the Bullet Graph with the title positioned above.
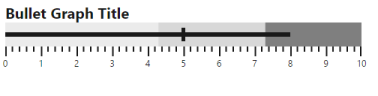
Bullet Graph with title automatically positioned above the scale
Text Alignment
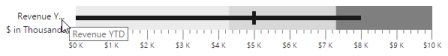
Alignment of text at different positions with respect to scale can be customized by using the TextAlignment property. Text can be aligned in the near, center, and far locations of the scale. Text alignment depends upon TextPosition property and is not applicable when the value of the TextPosition property is Float. The default value of the TextAlignment property is Near.
@(Html.EJ().BulletGraph("BulletGraph1").Width(650).Height(150).Value(8).ComparativeMeasureValue(5)

    .CaptionSettings(title=>title.Text("Revenue")

	.TextPosition(BulletTextPosition.Left)

	.TextAnchor(BulletTextAnchor.Middle)

	.Font(font=>

	font.FontSize("16px")

	.FontWeight("bold")

	)

	.SubTitle(subtitle=>subtitle.Text("$ in thousands")

	.TextPosition(BulletTextPosition.Left)

	.TextAlignment(BulletTextAlignment.Center)

	.Font(font=>

	font.FontSize("12px")

	.FontWeight("bold")

	)))

    .QuantitativeScaleSettings(scale=>scale.Location(loc=>loc.x(120).y(40)))

)
The following screenshot displays the Bullet Graph with the title and subtitle at different alignments.
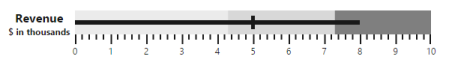
Bullet graph with the title aligned at near and sub title aligned at center positions
Text Anchor
Text elements aligned at the same position are anchored by using the TextAnchor property. These can be anchored at the Start, Middle, and End. The default value of this property is Start and applicable only when two or more text elements are aligned at the same position.
@(Html.EJ().BulletGraph("BulletGraph1").Width(650).Height(150).Value(8).ComparativeMeasureValue(5)

	.CaptionSettings(title=>title.Text("Revenue")

	.TextPosition(BulletTextPosition.Left)

	.TextAnchor(BulletTextAnchor.Middle)

	.Font(font=>

	font.FontSize("16px")

	.FontWeight("bold")

	)

	.SubTitle(subtitle=>subtitle.Text("$ in thousands")

	.TextPosition(BulletTextPosition.Left)

	.TextAlignment(BulletTextAlignment.Center)

	.Font(font=>

	font.FontSize("12px")

	.FontWeight("bold")

	)))

    .QuantitativeScaleSettings(scale=>scale.Location(loc=>loc.x(120).y(40)))

)
Bullet Graph with title text anchored at the center with respect to subtitle text
Padding
The space required between text and quantitative scale is customized by using the Padding property. The default value of this property is 5 and not applicable when the value of the TextPosition property is Float.
@(Html.EJ().BulletGraph("BulletGraph1").Width(650).Height(150).Value(8).ComparativeMeasureValue(5)

	.CaptionSettings(title=>title.Text("Profit in %")

	.TextPosition(BulletTextPosition.Left)

	.TextAlignment(BulletTextAlignment.Center)

	.Padding(10)

	.Font(font=>

	font.FontSize("16px")

	.FontWeight("bold")

	))

	.QuantitativeScaleSettings(scale=>scale.Location(loc=>loc.x(120).y(40)))

	)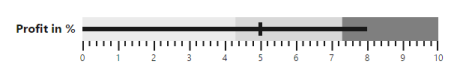
Bullet graph with 10 pixel padding between the title text and quantitative scale