How can I help you?
Getting started
This section explains briefly about how to create a Diagram control in your application with reactjs.
Adding Script Reference
Create an HTML page and add the scripts references in the order mentioned in the following code example.
-
jQuery1.10.2 and later versions
The required ReactJS script dependencies as follows. And you can also refer React to know more about react js.
-
react.min.js- https://cdn.syncfusion.com/js/assets/external/react.min.js -
react-dom.min.js- https://cdn.syncfusion.com/js/assets/external/react-dom.min.js -
ej.web.react.min.js- https://cdn.syncfusion.com/33.1.44/js/common/ej.web.react.min.js
To get started, you can use the ej.web.all.min.js file that encapsulates all the ej controls and frameworks in one single file.
<!DOCTYPE html>
   <html>
     <head>
        <meta name="viewport" content="width=device-width, initial-scale=1.0">
        <meta name="description" content="Essential Studio for React JS">
        <meta name="author" content="Syncfusion">
        <title>Getting Started for Ribbon React JS</title>
        <!-- Essential Studio for JavaScript  theme reference -->
        <link href="http://cdn.syncfusion.com/33.1.44/js/web/flat-azure/ej.web.all.min.css" rel="stylesheet" />
        <!-- Essential Studio for JavaScript  script references -->
        <script src="http://cdn.syncfusion.com/js/assets/external/jquery-3.0.0.min.js"></script>
        <script src="http://cdn.syncfusion.com/js/assets/external/react.min.js"></script>
        <script src="http://cdn.syncfusion.com/js/assets/external/react-dom.min.js"></script>
        <script src="http://cdn.syncfusion.com/33.1.44/js/web/ej.web.all.min.js"></script>
        <script src="http://cdn.syncfusion.com/33.1.44/js/common/ej.web.react.min.js"></script>
        <!-- Add your custom scripts here -->
    </head>
        <body>
        </body>
   </html>
NOTE
- In production, we highly recommend you to use our
custom script generatorto create custom script file with required controls and its dependencies only. Also to reduce the file size further please useGZip compressionin your server.- For themes, you can use the
ej.web.all.min.cssCDN link from the code snippet given. To add the themes in your application, please refer tothis link.
Control Initialization
Control can be initialized in two ways.
- Using jsx Template
- Without using jsx Template
Using jsx Template
By using the jsx template, we can create the html file and jsx file. The .jsx file can be convert to .js file and it can be referred in html page.
Initialize Diagram
Add a div container to render the Diagram.
<!DOCTYPE html>
<html>
    <body>
	<div id="diagram-default" style="height:99%;"></div>
            <script src="app/diagram/default.js"></script>
    </body>
</html>
Initialize the Diagram by using the EJ.Diagram tag. The Diagram is rendered based on default width and height. You can also customize the Diagram dimension by setting the width and height attribute in scrollSettings.
"use strict";
ReactDOM.render(
    <div className="default">
        <EJ.Diagram id="diagram1" width="100%" height="100%" ></EJ.Diagram>,
    </div>,
    document.getElementById('diagram-default')
    );
This creates an empty diagram as shown in image
Populate Diagram with nodes and connectors
Now, this section explains how to populate JSON data to the Diagram.
<script type="text/babel">

var def_nodes = [{
    // Unique name for the node
            name: "Start",
            // Position of the node
            offsetX: 300,
            offsetY: 50,
            // Size of the node
            width: 140,
            height: 50,
            // Text(label) added to the node
            labels: [{
                text: "Start"
            }],
            // Shape for the node
            type: "flow",
            shape: "terminator"
        },
        {
            name: "Init",
            offsetX: 300,
            offsetY: 140,
            width: 140,
            height: 50,
            labels: [{
                text: "var i = 0;"
            }],
            type: "flow",
            shape: "process"
            }
        ];

var def_connectors = [{
// Unique name for the connector
            name: "connector1",
            // Source and Target node's name to which connector needs to be connected.
            sourceNode: "Start",
            targetNode: "Init",
            // An empty orthogonal segment
            segments: [{ type: "orthogonal" }]
}];

<!DOCTYPE html>
<html>
    <body>
        <script type="text/babel">
            ReactDOM.render(
                     <div className="default">
                        <EJ.Diagram id="diagram1" width="100%" height="100%"  nodes: {def_nodes}, connectors: {def_connectors}, ></EJ.Diagram>,
                     </div>,
                     document.getElementById('diagram-default')
                     );
        </script>
    </body>
</html>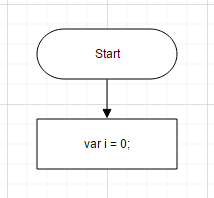
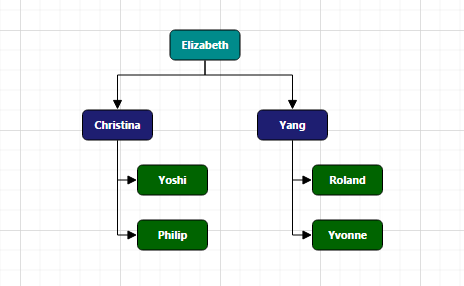
Business object (Employee information)
- Define Employee Information as JSON data. The following code example shows an employee array whose,
-
Nameis used as a unique identifier and -
ReportingPersonis used to identify the person to whom an employee report to, in the organization.
-
var data = [
	{ Name: "Elizabeth", Role: "Director" },
	{ Name: "Christina", ReportingPerson: "Elizabeth", Role: "Manager" },
	{ Name: "Yoshi", ReportingPerson: "Christina", Role: "Lead" },
	{ Name: "Philip", ReportingPerson: "Christina", Role: "Lead" },
	{ Name: "Yang", ReportingPerson: "Elizabeth", Role: "Manager" },
	{ Name: "Roland", ReportingPerson: "Yang", Role: "Lead" },
	{ Name: "Yvonne", ReportingPerson: "Yang", Role: "Lead" }
];
Without using jsx Template
The Diagram can be created from a HTML DIV element with the HTML id attribute set to it. Refer to the following code example.
-
You can configure data mapping using “Employee Information” with Diagram, so that the node and connector are automatically generated using mapping properties. DefaultSettings can define the default appearance of node and connector.
-
The NodeTemplate is used to update each node based on employee data.
-
The following code examples show how dataSourceSetting is used to map id and parent with property name identifiers for employee information.
<div id="diagram-organizationalchart" style="height:99%;">
</div>//To represent the roles
var codes = {
Director: "rgb(0, 139,139)",
Manager: "rgb(30, 30,113)",
Lead: "rgb(0, 100,0)"
}
//Binds custom data with node
function nodeTemplate(diagram, node) {
node.labels[0].text = node.Name;
node.fillColor = codes[node.Role];
}
var layout= { type: "organizationalchart", orientation: "toptobottom", horizontalSpacing: 25, verticalSpacing: 35, marginX: 3, marginY: 3};
var defaultSettings= {
node: { constraints: ej.datavisualization.Diagram.NodeConstraints.Select | ej.datavisualization.Diagram.NodeConstraints.PointerEvents, width: 100, height: 40, borderColor: "black", labels: [{ fontColor: "#ffffff" }] },
connector: {
lineColor: "#000000", segments: [{ type: "orthogonal" }], targetDecorator: { shape: "none" },
constraints: ej.datavisualization.Diagram.ConnectorConstraints.None
}
};
var dataSourceSettings = { id: "Name", parent: "ReportingPerson", dataSource: data }
function diagram5Create(args)
{
var height=$("#diagram4").height()- $(".e-box.e-addborderbottom.e-header").height()
$("#diagram4").ejDiagram({ height : height});
}
React.createElement(EJ.Diagram, {
id: "diagram5",
height: "100%",
width: "100%",
layout: layout,
defaultSettings: defaultSettings,
dataSourceSettings: dataSourceSettings,
nodeTemplate: nodeTemplate,
create: diagram5Create
}), document.getElementById('diagram-organizationalchart')- The Employee details are displayed in the Diagram as follows.