How can I help you?
Getting Started
To get start with the Diagram control using PHP wrapper classes, either of the following prerequisites needs to be installed in your machine to deploy and run those samples locally.
In this section, let’s see how to create a Diagram control in your application with PHP using Xampp server.
Creating a Sample Folder
Usually, the Xampp gets installed in C:\ drive. Now, create a new sample folder namely diagram within C:\\xampp\\htdocs and place all the below mentioned folders within it.
- Scripts - Includes all the script files necessary to render the control. [Optional, if cdn links are used in the sample]
- CSS - Includes all the required stylesheet files. [Optional, if cdn links are used in the sample]
- PHP Class Libraries - Includes the individual PHP wrapper class files for all the controls. [Mandatory]
- Sample PHP file (with .php extension). [Mandatory]
Adding Scripts and CSS files
The required scripts and CSS files can be copied into the above created sample folder namely diagram and then can be manually referred on the sample page or else the cdn links can be referred directly. In case, if you are manually referring the scripts and CSS files in your PHP sample, refer this topic to know how to copy the required scripts and CSS from the installed location.
Adding PHP Class libraries
Copy the PHP class libraries into your sample folder, which are the collection of PHP wrapper files created individually for all the controls in order to access and process its server-side values and then send it back to the client-side. These libraries are available within the following installed location -
-
(Installed Location)\Syncfusion\Essential Studio\33.1.44\PHP\Src
Create a PHP file
Create a first PHP file in Xampp and name it appropriately with .php extension and also place it under the newly created sample folder diagram. For example, say Index.php with the initial code as shown below -
<!DOCTYPE html>
    <html>
        <head>
            <title>Getting Started - Diagram</title>
            <!--Dependency files references-->
        </head>
        <body>
            <?php
            ?>
        </body>
    </html>
Scripts and CSS references
Refer the required scripts and CSS files in your PHP page as mentioned below in order to render the Diagram control -
<!DOCTYPE html>
    <html>
        <head>
                <title>Getting Started - Diagram</title>
                <link href="http://cdn.syncfusion.com/33.1.44/js/web/flat-azure/ej.web.all.min.css" rel="stylesheet" />
                <link href="http://cdn.syncfusion.com/33.1.44/js/web/responsive-css/ej.responsive.css" rel="stylesheet" />
                <script src="http://cdn.syncfusion.com/js/assets/external/jquery-3.0.0.min.js"></script>
                <script src="http://cdn.syncfusion.com/js/assets/external/jsrender.min.js"></script>
                <script src="http://cdn.syncfusion.com/33.1.44/js/web/ej.web.all.min.js"></script>
        </head>
        <body>
            <?php
            ?>
        </body>
    </html>
AutoLoad file reference
Include the PHP AutoLoad file reference within the body section of the PHP page.
<!DOCTYPE html>
    <html>
        <head>
                <title>Getting Started - Diagram</title>
                <link href="http://cdn.syncfusion.com/33.1.44/js/web/flat-azure/ej.web.all.min.css" rel="stylesheet" />
                <link href="http://cdn.syncfusion.com/33.1.44/js/web/responsive-css/ej.responsive.css" rel="stylesheet" />
                <script src="http://cdn.syncfusion.com/js/assets/external/jquery-3.0.0.min.js"></script>
                <script src="http://cdn.syncfusion.com/js/assets/external/jsrender.min.js"></script>
                <script src="http://cdn.syncfusion.com/33.1.44/js/web/ej.web.all.min.js"></script>
        </head>
        <body>
            <?php require_once 'EJ\AutoLoad.php'; ?>
        </body>
    </html>
Initialize Diagram with nodes and connectors
Create the Diagram control object by accessing the Diagram namespace EJ\\Diagram using new keyword. Define its properties and then output the Diagram control by echoing the result object.
<body>
<?php
    require_once 'EJ\AutoLoad.php';
    $diagram=new EJ\Diagram("diagram1");
    $nodes= array(getNode("Start", 300, 50, 140, 50, "Start", "terminator"),
                  getNode("Init", 300, 140, 140, 50, "var i = 0;", "process")
                  );
    $connectors= array(getConnector("connector1", "Start","Init",""));
    $defaultNode=new EJ\Diagram\Node();
    $defaultNodeLabel=new EJ\Diagram\Label();

    $defaultConnector=new EJ\Diagram\Connector();
    $defaultconnectorLabel=new EJ\Diagram\Label();
    $defaultconnectorLabel->fillColor("white");
    $defaultConnector->labels(array($defaultconnectorLabel));

    $defaultSettings=new EJ\Diagram\DefaultSetting();
    $defaultSettings->node($defaultNode)->connector($defaultConnector);

    echo $diagram->width("1000px")->height("600px")->nodes($nodes)->connectors($connectors)->defaultSettings($defaultSettings)
    ->render();

    function getNode($name, $x, $y, $width,$height, $text, $shape) {
        $node=new EJ\Diagram\Node();
        $label=new EJ\Diagram\Label();
        $label->text($text);
        $node->name($name)->offsetX($x)->offsetY($y)->height($height)->width($width)->labels(array($label))->type("flow")->shape($shape);
        return $node;
    }

    function getConnector($name, $snode, $tnode,  $text) {
        $connector=new EJ\Diagram\Connector();
        $label=new EJ\Diagram\Label();
        $connector->name($name)->sourceNode($snode)->targetNode($tnode)->labels(array($label));
        return $connector;
    }
    ?>
</body>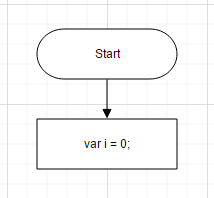
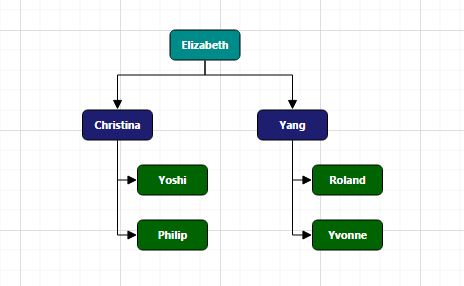
Business object (Employee information)
- Define Employee Information as JSON data. The following code example shows an employee array whose,
-
Nameis used as a unique identifier and -
ReportingPersonis used to identify the person to whom an employee report to, in the organization.
-
function nodeTemplate(diagram, node) {
        node.labels[0].text = node.Name;
        node.fillColor = codes[node.Role];
        }
let codes = {
            Director: "rgb(0, 139,139)",
            Manager: "rgb(30, 30,113)",
            Lead: "rgb(0, 100,0)"
            }
 $localData = array(
     array( "Name"=> "Elizabeth", "Role"=> "Director"),
     array( "Name"=> "Christina", "ReportingPerson"=> "Elizabeth", "Role"=> "Manager" ),
	 array( "Name"=> "Yoshi", "ReportingPerson"=> "Christina", "Role"=> "Lead" ),
	 array( "Name"=> "Philip", "ReportingPerson"=> "Christina", "Role"=> "Lead"  ),
     array( "Name"=> "Yang", "ReportingPerson"=> "Elizabeth", "Role"=> "Manager" ),
     array( "Name"=> "Roland", "ReportingPerson"=> "Yang", "Role"=> "Lead" ),
     array( "Name"=> "Yvonne", "ReportingPerson"=> "Yang", "Role"=> "Lead" )
     );
    $diagram=new EJ\Diagram("diagram1");

    $layout=new EJ\Diagram\Layout();
    $margin=new EJ\Diagram\Margin();
    $margin->top(50);
    $layout->type("organizationalchart")->margin($margin);

    $defaultNode=new EJ\Diagram\Node();
    $defaultNodeLabel=new EJ\Diagram\Label();
    $defaultNodeLabel->fontColor("#ffffff");
    $defaultNode->width(100)->height(40)->borderColor("black")->borderWidth(1)->labels(array($defaultNodeLabel));

    $defaultConnector=new EJ\Diagram\Connector();
    $segment=new EJ\Diagram\Segment();
    $segment->type("orthogonal");
    $targetDecorator=new EJ\Diagram\TargetDecorator();
    $targetDecorator->shape("arrow");
    $defaultConnector->lineColor("#000000")->segments(array($segment))->constraints("None")->targetDecorator($targetDecorator);

    $dataSourceSettings= new EJ\Diagram\DataSourceSetting();
    $dataSourceSettings->dataSource($localData)->id("Name")->parent("ReportingPerson");

    $defaultSettings=new EJ\Diagram\DefaultSetting();
    $defaultSettings->node($defaultNode)->connector($defaultConnector);

    echo $diagram->width("100%")->tool(8)->height("500px")
    ->tool(8)
    ->layout($layout)
    ->defaultSettings($defaultSettings)
    ->nodeTemplate("nodeTemplate")
    ->dataSourceSettings($dataSourceSettings)
->render();- The Employee details are displayed in the Diagram as follows.