Empty points in .NET MAUI Cartesian Chart
10 Jul 20267 minutes to read
Empty points are used to indicate missing or null data in a series. These empty points can occur when data is unavailable, improperly formatted, or explicitly set as null or double.NaN. The chart provides options to handle and customize these empty points to enhance visualization and maintain the integrity of data representation.
SfCartesianChart provides support for empty points, allowing users to handle missing data effectively.
NOTE
Prerequisite: Ensure that the required NuGet package is installed, the necessary namespaces are imported, and the SfCartesianChart control is properly configured in your application. For detailed setup and configuration instructions, refer to the Getting Started guide.
The data collection that is passed to the chart can have NaN or null values that are considered as empty points. The empty points can be defined as in the following code example.
ProductSales = new ObservableCollection<Model>();
ProductSales.Add(new Model() { Product = "Electronics", Sales = 60 });
ProductSales.Add(new Model() { Product = "Clothing", Sales = 40 });
ProductSales.Add(new Model() { Product = "Groceries", Sales = double.NaN });
ProductSales.Add(new Model() { Product = "Furniture", Sales = 70 });
ProductSales.Add(new Model() { Product = "Toys", Sales = 30 });
ProductSales.Add(new Model() { Product = "Sports", Sales = double.NaN });
ProductSales.Add(new Model() { Product = "Books", Sales = 50 });
By default, the EmptyPointMode property is None. So the empty points will not be rendered as shown below.

Empty point mode
The EmptyPointMode property of the series specifies how empty points should be handled.
This property provides the following options:
- None - Empty points are not rendered. This is the default behavior.
- Zero - Empty points will be replaced with zero.
- Average - Empty points will be replaced with the average value of the surrounding data points.
The following code example shows the EmptyPointMode as Zero.
<chart:SfCartesianChart>
    <!-- code omitted for brevity -->
   <chart:LineSeries ItemsSource="{Binding ProductSales}"
                  XBindingPath="Product"
                  YBindingPath="Sales"
                  EmptyPointMode="Zero">
   </chart:LineSeries>

</chart:SfCartesianChart>
SfCartesianChart chart = new SfCartesianChart();
//code omitted for brevity
LineSeries series = new LineSeries()
{
ItemsSource = new ViewModel().ProductSales,
XBindingPath = "Product",
YBindingPath = "Sales",
EmptyPointMode = EmptyPointMode.Zero
};
chart.Series.Add(series);
this.Content = chart;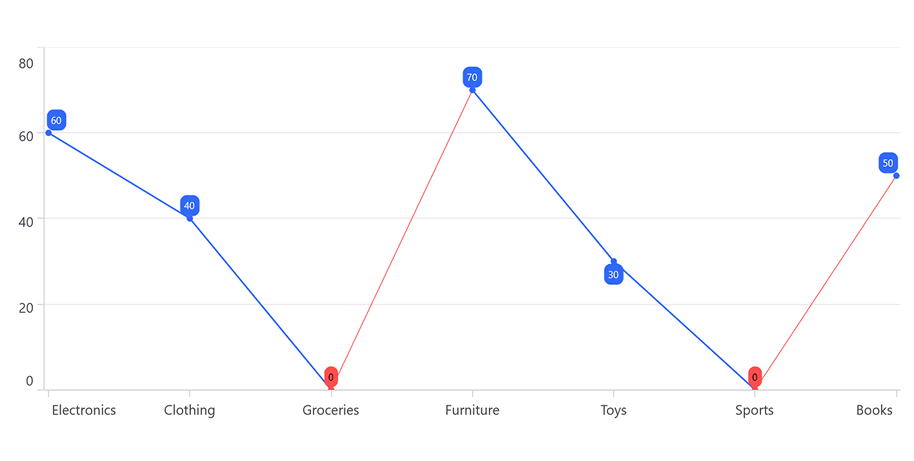
The following code example shows the EmptyPointMode as Average.
<chart:SfCartesianChart>
    <!-- code omitted for brevity -->
   <chart:ColumnSeries ItemsSource="{Binding ProductSales}"
                  XBindingPath="Product"
                  YBindingPath="Sales"
                  EmptyPointMode="Average">
   </chart:ColumnSeries>

</chart:SfCartesianChart>
SfCartesianChart chart = new SfCartesianChart();
//code omitted for brevity
ColumnSeries series = new ColumnSeries()
{
ItemsSource = new ViewModel().ProductSales,
XBindingPath = "Product",
YBindingPath = "Sales",
EmptyPointMode = EmptyPointMode.Average
};
chart.Series.Add(series);
this.Content = chart;
Empty point customization
The EmptyPointSettings property allows you to customize the appearance of empty points in a series. This enables you to adjust various visual aspects of empty points, making them more distinct from the other data points. You can modify the following properties within EmptyPointSettings.
- Fill - Gets or sets the fill color for the empty points.
- Stroke - Gets or sets the stroke color for empty points.
- StrokeWidth - Gets or sets the stroke thickness for empty points.
<chart:SfCartesianChart>
    <!-- code omitted for brevity -->
   <chart:LineSeries ItemsSource="{Binding ProductSales}"
                  XBindingPath="Product"
                  YBindingPath="Sales"
                  Fill="#3068F7"
                  StrokeWidth="2"
                  ShowMarkers="True"
                  ShowDataLabels="True"
                  EmptyPointMode="Average">
        <chart:LineSeries.EmptyPointSettings>
            <chart:EmptyPointSettings Fill="Orange" StrokeWidth="2"/>
        </chart:LineSeries.EmptyPointSettings>
    </chart:LineSeries>

</chart:SfCartesianChart>
SfCartesianChart chart = new SfCartesianChart();
//code omitted for brevity
LineSeries series = new LineSeries()
{
ItemsSource = new ViewModel().ProductSales,
XBindingPath = "Product",
YBindingPath = "Sales",
Fill = Color.FromArgb("#3068F7"),
StrokeWidth = 2,
ShowMarkers = true,
ShowDataLabels = true,
EmptyPointMode = EmptyPointMode.Average
};
EmptyPointSettings emptypointSettings = new EmptyPointSettings()
{
Fill = Colors.Orange,
StrokeWidth = 2
};
series.EmptyPointSettings = emptypointSettings;
chart.Series.Add(series);
this.Content = chart;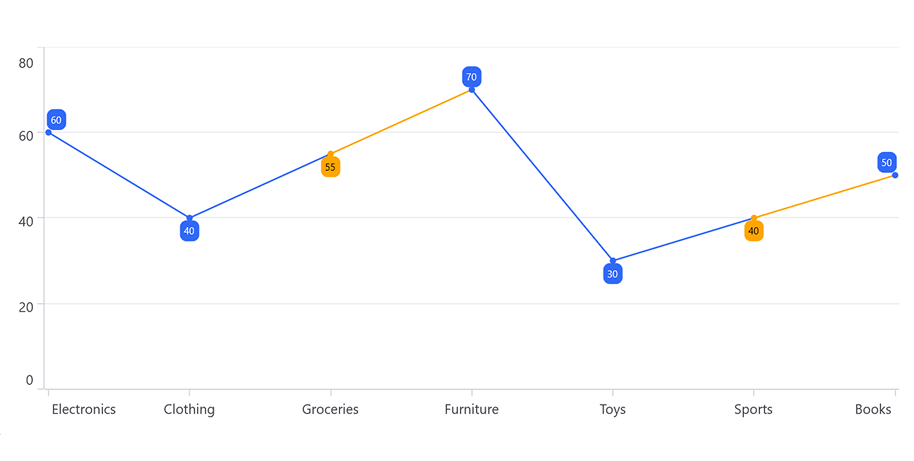
NOTE
EmptyPoint support is not applicable for Histogram and BoxAndWhisker series.