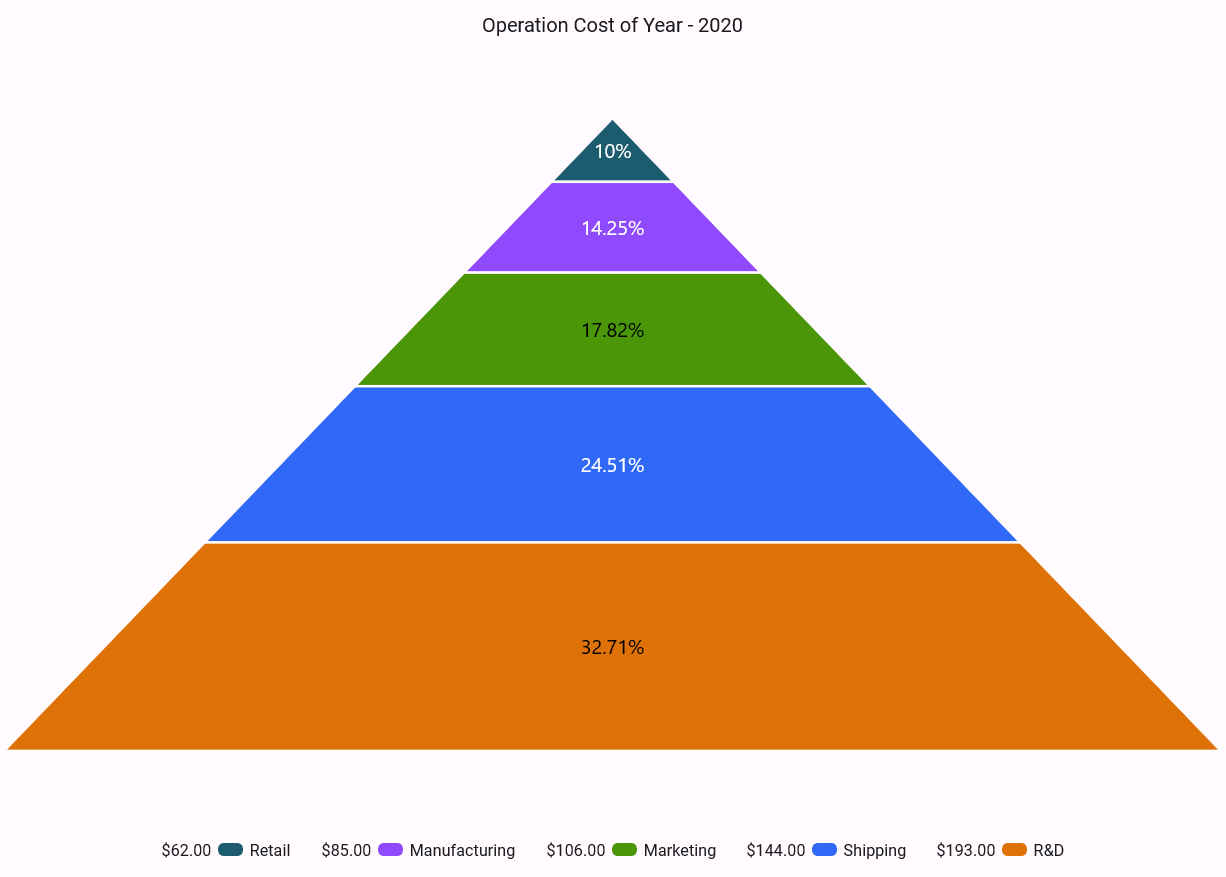
Overview of .NET MAUI Pyramid Chart
The Syncfusion® Toolkit for .NET MAUI Pyramid Chart (SfPyramidChart) provides a visually appealing way to represent proportions within hierarchical data. It is widely used to display data as percentages of a total, with each segment representing a part of the whole. This single-series chart, without axes, is perfect for high-quality .NET MAUI applications.
Business use cases
- Business analytics applications that require visualizing hierarchical data such as stages or levels in a process.
- Sales and marketing dashboards that display conversion rates and drop-off analysis across stages.
- Reporting tools that present proportional distribution of values in a structured pyramid layout.
- Enterprise applications that require clear visualization of contribution percentages within a dataset.
Key features
- User interaction allows enabling selection and tooltip features to explore data segments easily.
- Interactive experience improvements allow highlighting segments and displaying additional details through tooltips.
- Legend allows presenting information about each segment with scrolling for overflow content.
- Rich customization allows configuring chart elements such as titles, data labels, legends, and segment spacing.
Globalization
The following table summarizes the globalization support available in this control.
| Control | Localization | RTL | Time zone | Screen reader | Keyboard navigation |
|---|---|---|---|---|---|
| Pyramid Charts |
Related controls
- Funnel Charts for visualizing process stages and conversion flows using funnel charts.
- Circular Charts for representing proportional data using pie and doughnut charts.
- Cartesian Charts for visualizing data trends and comparisons using axis-based charts.
See Also
- Getting Started shows a step‑by‑step guide to begin using the Pyramid Chart control.
- Customization explains how to customize chart appearance and behavior.
- Labels helps configure data labels and segment details.
- UI Kit provides interactive demos and ready‑made UI examples.
Resources
Feature Tour
Get a quick overview of key features and capabilities to kick start your journey.
Explore Features
Showcase Samples
Explore real-world sample apps to see components in action and learn by example.
View Samples
Tutorial Videos
Watch step‑by‑step video guides to quickly understand concepts and implementation.
Watch now
Knowledge Base
Find practical solutions, troubleshooting tips and how‑to guides for common scenarios.
Search KB's