Getting Started with .NET MAUI Pyramid Chart
This section explains how to populate the Pyramid Chart with data, including adding a title, data labels, a legend, and tooltips. It also covers the essential aspects needed to get started with the Pyramid Chart.
Prerequisites
Before proceeding, ensure the following are set up:
- Install .NET 9 SDK or later.
- Set up a .NET MAUI environment with Visual Studio 2022 v17.12 or later.
Step 1: Create a new .NET MAUI project
- Go to File > New > Project and choose the .NET MAUI App template.
- Name the project and choose a location. Then click Next.
- Select the .NET framework version and click Create.
Step 2: Install the Syncfusion® .NET MAUI Toolkit NuGet package
- In Solution Explorer, right-click the project and choose Manage NuGet Packages.
- Search for Syncfusion.Maui.Toolkit and install the latest version.
- Ensure the necessary dependencies are installed correctly, and the project is restored.
Prerequisites
Before proceeding, ensure the following are set up:
- Install .NET 9 SDK or later.
- Set up a .NET MAUI environment with Visual Studio Code.
- Ensure that the .NET MAUI workloads are installed and configured as described here.
Step 1: Create a new .NET MAUI project
- Open the command palette by pressing
Ctrl+Shift+Pand type .NET:New Project and enter. - Choose the .NET MAUI App template.
- Select the project location, type the project name and press Enter.
- Then choose Create project.
Step 2: Install the Syncfusion® .NET MAUI Toolkit NuGet package
- Press Ctrl + ` (backtick) to open the integrated terminal in Visual Studio Code.
- Ensure you’re in the project root directory where your .csproj file is located.
- Run the command
dotnet add package Syncfusion.Maui.Toolkitto install the Syncfusion® .NET MAUI Toolkit NuGet package. - To ensure all dependencies are installed, run
dotnet restore.
Prerequisites
Before proceeding, ensure the following are set up:
- Install .NET 9 SDK or later.
- Set up a .NET MAUI environment with JetBrains Rider 2024.3 or later.
- Make sure the MAUI workloads are installed and configured as described here.
Step 1: Create a new .NET MAUI project
- Go to File > New Solution, Select .NET (C#) and choose the .NET MAUI App template.
- Enter the Project Name, Solution Name, and Location.
- Select the .NET framework version and click Create.
Step 2: Install the Syncfusion® MAUI Toolkit NuGet package
- In Solution Explorer, right-click the project and choose Manage NuGet Packages.
- Search for Syncfusion.Maui.Toolkit and install the latest version.
- Ensure the necessary dependencies are installed correctly, and the project is restored. If not, Open the Terminal in Rider and manually run:
dotnet restore
Step 3: Register Syncfusion handler
Make sure to add the namespace.
using Syncfusion.Maui.Toolkit.Hosting;Register the Syncfusion toolkit handler in your CreateMauiApp method of MauiProgram.cs file to use Syncfusion controls.
builder.ConfigureSyncfusionToolkit();Step 4: Create the Model
Define a simple data model to represent a data point in the chart:
public class StageModel
{
    public string Name { get; set; }
    public double Value { get; set; }
}
Step 5: Create the ViewModel
Next, create a StageViewModel class and initialize a list of StageModel objects:
public class StageViewModel
{
    public List<StageModel> Data { get; set; }
    public StageViewModel()
    {
        Data = new List<StageModel>()
        {
            new StageModel(){Name = "Stage A", Value = 12},
            new StageModel(){Name = "Stage B", Value = 21},
            new StageModel(){Name = "Stage C", Value = 29},
            new StageModel(){Name = "Stage D", Value = 37},
        };
    }
}
Step 6: Import Pyramid Chart namespace
Add the following namespace in your XAML or C#.
xmlns:chart="clr-namespace:Syncfusion.Maui.Toolkit.Charts;assembly=Syncfusion.Maui.Toolkit"using Syncfusion.Maui.Toolkit.Charts;Step 7: Add the Pyramid Chart component
Binding Data to the pyramid chart ItemsSource property from its BindingContext to create our own pyramid chart.
<chart:SfPyramidChart ItemsSource="{Binding Data}"
                       ShowDataLabels="True"
                       EnableTooltip="True"
                       XBindingPath="Name"
                       YBindingPath="Value">
        <chart:SfPyramidChart.Title>
            <Label Text="Pyramid Stages"/>
        </chart:SfPyramidChart.Title>
        <chart:SfPyramidChart.BindingContext>
            <model:StageViewModel/>
        </chart:SfPyramidChart.BindingContext>
        <chart:SfPyramidChart.Legend>
            <chart:ChartLegend/>
        </chart:SfPyramidChart.Legend>
    </chart:SfPyramidChart>
SfPyramidChart chart = new SfPyramidChart();
chart.Title = new Label()
{
Text = "Pyramid Stages"
};
chart.Legend = new ChartLegend();
StageViewModel viewModel = new StageViewModel();
chart.BindingContext = viewModel;
chart.ItemsSource = viewModel.Data;
chart.XBindingPath = "Name";
chart.YBindingPath = "Value";
chart.EnableTooltip = true;
chart.ShowDataLabels = true;
this.Content = chart;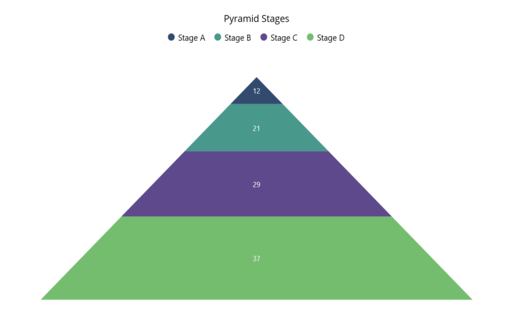
You can download the Pyramid Chart Getting Started sample from here.