Appearance in .NET MAUI Pyramid Chart
The appearance of the SfPyramidChart can be customized by using the predefined palettes, custom palettes, and gradient which allows enriching the application.
Add a title
The title of the chart acts as the title to provide quick information to the user about the data being plotted in the chart. You can set the title using the Title property of the pyramid chart as follows.
<chart:SfPyramidChart>
    <chart:SfPyramidChart.Title>
        <Label Text="Pyramid Stages"/>
    </chart:SfPyramidChart.Title>
    . . .
</chart:SfPyramidChart>
SfPyramidChart chart = new SfPyramidChart();
// Set the title of the chart.
chart.Title = new Label()
{
Text = "Pyramid Stages",
};
this.Content = chart;Custom PaletteBrushes
The SfPyramidChart allows you to define your own brushes with preferred order by using the PaletteBrushes property, as shown in the code below.
<chart:SfPyramidChart ItemsSource="{Binding Data}"
                      XBindingPath="Name"
                      YBindingPath="Value"
                      PaletteBrushes="{Binding CustomBrushes}">
. . .
</chart:SfPyramidChart>
public class StageViewModel
{
public ObservableCollection<Model> Data { get; set; }
public List<Brush> CustomBrushes { get; set; }
public StageViewModel()
{
//Initializing CustomBrushes collection to add custom palette colors.
CustomBrushes = new List<Brush>();
CustomBrushes.Add(new SolidColorBrush(Color.FromRgb(38, 198, 218)));
CustomBrushes.Add(new SolidColorBrush(Color.FromRgb(0, 188, 212)));
CustomBrushes.Add(new SolidColorBrush(Color.FromRgb(0, 172, 193)));
CustomBrushes.Add(new SolidColorBrush(Color.FromRgb(0, 151, 167)));
CustomBrushes.Add(new SolidColorBrush(Color.FromRgb(0, 131, 143)));
}
. . .
}
Applying Gradient
The gradient for the pyramid chart can be set by using the PaletteBrushes property of the chart with the help of the LinearGradientBrush or RadialGradientBrush.
<chart:SfPyramidChart ItemsSource="{Binding Data}"
                      XBindingPath="Name"
                      YBindingPath="Value"
                      PaletteBrushes="{Binding CustomBrushes}">
. . .
</chart:SfPyramidChart>
public class StageViewModel
{
public ObservableCollection<Model> Data { get; set; }
public List<Brush> CustomBrushes { get; set; }
public StageViewModel()
{
CustomBrushes = new List<Brush>();
LinearGradientBrush gradientColor1 = new LinearGradientBrush();
gradientColor1.GradientStops = new GradientStopCollection()
{
new GradientStop() { Offset = 1, Color = Color.FromArgb("#a3bded") },
new GradientStop() { Offset = 0, Color = Color.FromArgb("#6991c7") },
};
LinearGradientBrush gradientColor2 = new LinearGradientBrush();
gradientColor2.GradientStops = new GradientStopCollection()
{
new GradientStop() { Offset = 1, Color = Color.FromArgb("#A5678E") },
new GradientStop() { Offset = 0, Color = Color.FromArgb("#E8B7D4") }
};
LinearGradientBrush gradientColor3 = new LinearGradientBrush();
gradientColor3.GradientStops = new GradientStopCollection()
{
new GradientStop() { Offset = 1, Color = Color.FromArgb("#FFCAD4") },
new GradientStop() { Offset = 0, Color = Color.FromArgb("#FB7B8E") }
};
LinearGradientBrush gradientColor4 = new LinearGradientBrush();
gradientColor4.GradientStops = new GradientStopCollection()
{
new GradientStop() { Offset = 1, Color = Color.FromArgb("#FDC094") },
new GradientStop() { Offset = 0, Color = Color.FromArgb("#FFE5D8") }
};
LinearGradientBrush gradientColor5 = new LinearGradientBrush();
gradientColor5.GradientStops = new GradientStopCollection()
{
new GradientStop() { Offset = 1, Color = Color.FromArgb("#CFF4D2") },
new GradientStop() { Offset = 0, Color = Color.FromArgb("#56C596") }
};
//Adding gradient brush to the custom brushes collection.
CustomBrushes.Add(gradientColor1);
CustomBrushes.Add(gradientColor2);
CustomBrushes.Add(gradientColor3);
CustomBrushes.Add(gradientColor4);
CustomBrushes.Add(gradientColor5);
}
. . .
}
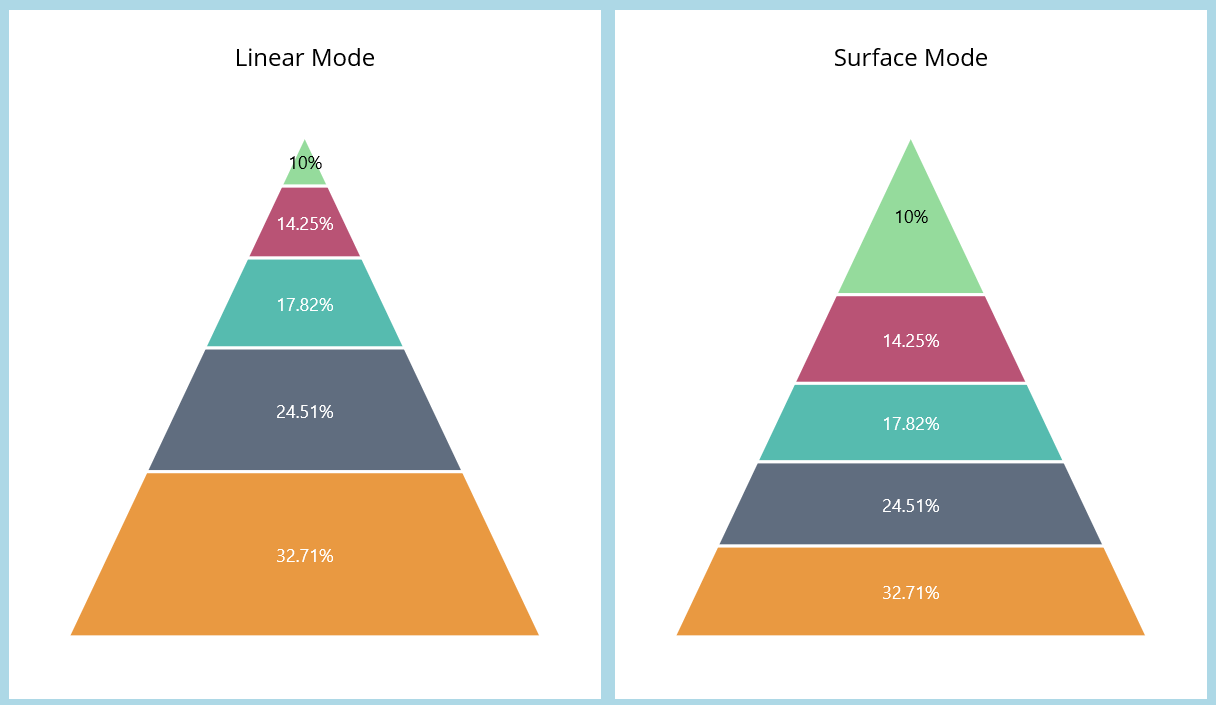
Pyramid modes
The SfPyramidChart allows you to render a chart in a linear or surface mode by using the Mode property. In the Linear mode, the height of the pyramid segment is based on the y-value. In the Surface mode, the area of the pyramid segment is based on the y-value. By default, the Mode property is set to linear.
<chart:SfPyramidChart ItemsSource="{Binding Data}"
                      XBindingPath="XValue"
                      YBindingPath="YValue"
                      Mode="Surface">
</chart:SfPyramidChart>
SfPyramidChart chart = new SfPyramidChart();
ViewModel viewModel = new ViewModel();
chart.ItemsSource = viewModel.Data;
chart.XBindingPath = "XValue";
chart.YBindingPath = "YValue";
chart.Mode = PyramidMode.Surface; //Setting the pyramid mode for the chart.
this.Content = chart;