Doughnut Chart in .NET MAUI Chart
DoughnutSeries is similar to PieSeries. It is used to show the relationship between parts of data and whole data. To render a DoughnutSeries in circular chart, create an instance of the DoughnutSeries and add it to the Series collection property of SfCircularChart.
NOTE
The circular chart has Series as its default content.
<chart:SfCircularChart>
    <chart:DoughnutSeries ItemsSource="{Binding Data}"
                          XBindingPath="Product"
                          YBindingPath="SalesRate"/>
</chart:SfCircularChart>
// Create a new instance of SfCircularChart
SfCircularChart chart = new SfCircularChart();
DoughnutSeries series = new DoughnutSeries(); // Create a new instance of DoughnutSeries
series.ItemsSource = (new SalesViewModel()).Data;
series.XBindingPath = "Product";
series.YBindingPath = "SalesRate";
chart.Series.Add(series); // Add the series to the chart's Series collection
this.Content = chart;
Inner Radius
The InnerRadius property of doughnut series is used to define the inner circle.
<chart:SfCircularChart>
    <chart:DoughnutSeries ItemsSource="{Binding Data}"
                          InnerRadius="0.7"
                          XBindingPath="Product"
                          YBindingPath="SalesRate"/>
</chart:SfCircularChart>
SfCircularChart chart = new SfCircularChart();
DoughnutSeries series = new DoughnutSeries();
series.ItemsSource = (new SalesViewModel()).Data;
series.XBindingPath = "Product";
series.YBindingPath = "SalesRate";
series.InnerRadius = 0.7; // Set the inner radius of the doughnut chart (70% of the available space)
chart.Series.Add(series);
this.Content = chart;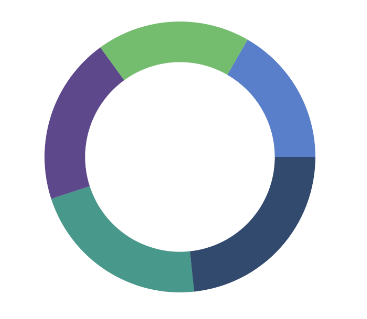
Semi Doughnut
By using the StartAngle and EndAngle properties, you can draw doughnut series in different shapes such as semi-doughnut or quarter doughnut series.
<chart:SfCircularChart>
    <chart:DoughnutSeries ItemsSource="{Binding Data}"
                          XBindingPath="Product"
                          YBindingPath="SalesRate"
                          StartAngle="180" EndAngle="360"/>
</chart:SfCircularChart>
SfCircularChart chart = new SfCircularChart();
DoughnutSeries series = new DoughnutSeries();
series.ItemsSource = (new SalesViewModel()).Data;
series.XBindingPath = "Product";
series.YBindingPath = "SalesRate";
series.StartAngle = 180; // Set the starting angle of the doughnut chart (in degrees)
series.EndAngle = 360; // Set the ending angle of the doughnut chart (in degrees)
chart.Series.Add(series);
this.Content = chart;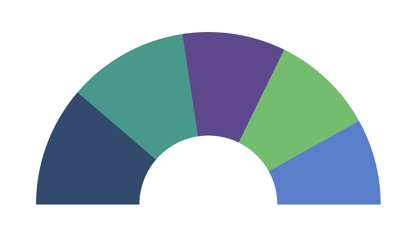
Center View
The view placed in the center of the doughnut chart is useful for sharing additional information about the doughnut chart. Any view can be added to the center of the doughnut chart using the CenterView property of DoughnutSeries. The binding context of the CenterView will be the respective doughnut series.
Center Hole Size
The CenterHoleSize property of DoughnutSeries is used to get the diameter value of the center hole. Using the CenterHoleSize, we can protect the view in the doughnut center from overlapping with the series.
<chart:SfCircularChart>
    <chart:DoughnutSeries ItemsSource="{Binding Data}" XBindingPath="Name" YBindingPath="Value"/>
        <chart:DoughnutSeries.CenterView>
            <Border HeightRequest="{Binding CenterHoleSize}" WidthRequest="{Binding CenterHoleSize}">
                <Border.StrokeShape>
                    <RoundRectangle CornerRadius="200"/>
                </Border.StrokeShape>
                <StackLayout>
                    <Label Text="Total :"/>
                    <Label Text="357,580 km²"/>
                </StackLayout>
            </Border>
        </chart:DoughnutSeries.CenterView>
    </chart:DoughnutSeries>
</chart:SfCircularChart>
SfCircularChart chart = new SfCircularChart();
// Create a new DoughnutSeries
DoughnutSeries series = new DoughnutSeries();
series.ItemsSource = (new ViewModel()).Data;
series.XBindingPath = "Name";
series.YBindingPath = "Value";
Border border = new Border(); // Create a border to contain the center view content
Label name = new Label();
name.Text = "Total :";
Label value = new Label();
value.Text = "357,580 km²";
StackLayout layout = new StackLayout();
layout.Children.Add(name);
layout.Children.Add(value);
border.Content = layout;
series.CenterView = border; // Set the border (containing the labels) as the center view of the doughnut series
chart.Series.Add(series);
this.Content = chart;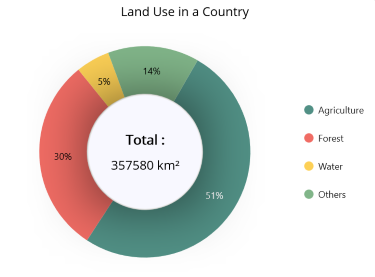
CapStyle customization
The CapStyle property of the doughnut series is used to specify the shape of the start and end points of the circular segment. The default value of this property is Both.Flat.
The following types are available for CapStyle property.
-
BothFlat - Start and end positions of the segment should be updated with a flat shape.
-
BothCurve - Start and end positions of the segment should be updated with a curve shape.
-
StartCurve - Start position of the segment should be updated with a curve shape.
-
EndCurve - End position of the segment should be updated with a curve shape.
To achieve smoother curves when using CapStyle values, consider increasing the InnerRadius value. A higher InnerRadius reduces the radial thickness of the segment, allowing the Bezier curves to appear more natural and visually appealing.
BothCurve
You can customize the CapStyle property of the doughnut series based on its types.
<chart:SfCircularChart>
    <chart:DoughnutSeries ItemsSource="{Binding Data}"
                          XBindingPath="Product"
                          YBindingPath="SalesRate"
                          CapStyle="BothCurve"
                          InnerRadius="0.8"/>
    </chart:SfCircularChart>
SfCircularChart chart = new SfCircularChart();
DoughnutSeries series = new DoughnutSeries();
series.ItemsSource = (new SalesViewModel()).Data;
series.XBindingPath = "Product";
series.YBindingPath = "SalesRate";
series.CapStyle = CapStyle.BothCurve; // Set the cap style for the series
series.InnerRadius = 0.8;
chart.Series.Add(series);
this.Content = chart;Segment Spacing
The GapRatio property defines the gap between individual doughnut segments. By default, its value is set to 0, meaning there is no gap between the segments. The value can range from 0 to 1, where 0 represents 0% spacing and 1 represents 100% spacing.
<chart:SfCircularChart>
    <chart:DoughnutSeries ItemsSource="{Binding Data}"
                          XBindingPath="Product"
                          YBindingPath="SalesRate"
                          GapRatio="0.2"/>
</chart:SfCircularChart>
SfCircularChart chart = new SfCircularChart();
DoughnutSeries series = new DoughnutSeries();
series.ItemsSource = (new SalesViewModel()).Data;
series.XBindingPath = "Product";
series.YBindingPath = "SalesRate";
series.GapRatio = 0.2; // Set the gap between each doughnut segments
chart.Series.Add(series);
this.Content = chart;