Quantitative Scale
8 Jan 201821 minutes to read
The Quantitative Scale appearance is customized using quantitativeScaleSettings property. It has properties to customize labels, major ticks, minor ticks, comparative measure and performance measure of the bullet graph
Range for Quantitative Scale
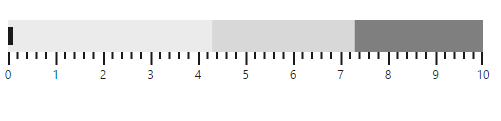
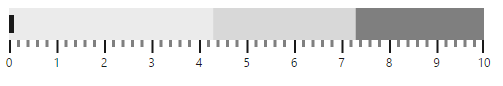
Quantitative Scale range is set using the properties minimum, maximum and interval of quantitativeScaleSettings property. Minimum specifies the start range of the scale, maximum specifies the end range of scale and interval specifies the number of intervals between start and end range. Default values of minimum, maximum and interval are 0, 10 and 1 respectively. The number of minor ticks (ticks between intervals) are specified using minorTicksPerInterval property.
$("#BulletGraph1").ejBulletGraph({
                    quantitativeScaleSettings: {
                        minimum: 0,
                        maximum: 10,
                        interval: 1,
                        minorTicksPerInterval: 4
                    },
                });
The following screenshot displays a Bullet Graph with start range 0, end range 10 and interval 1 with 4 minor ticks per interval
Quantitative scale location
Bullet Graph does not position Quantitative scale automatically based on its size or space required for caption text, etc. By default Quantitative scale is positioned at 10 pixels from left and 10 pixels from top. Quantitative scale location is customized as per the requirement using the location property available in quantitativeScaleSettings. Using the this property you can set X and Y location of the quantitative scale.
$("#BulletGraph1").ejBulletGraph({
                    quantitativeScaleSettings: {
                        location: { x: 20, y: 20 }
                    },
                });
The following screenshot displays Bullet Graph with Quantitative scale at 20 pixels from left and 20 pixels from top
Major ticks
Color, size and width of Major tick lines are customized using major tick settings property in quantitativeScaleSettings. Default value of size and width properties are 13 and 2 respectively. Ticks are drawn in black color by default. The property size represents the height of tick lines and width represents the width of tick lines and ticks color are customized using stroke property.
$("#BulletGraph1").ejBulletGraph({
quantitativeScaleSettings: {
majorTickSettings: {
size: 15,
width: 3,
stroke: 'gray'
}
},
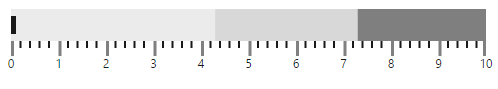
});The following screenshot displays Major ticks in gray color with a width of 3 pixels and height 15 pixels.
Minor ticks
Minor ticks can also be customized similar to major ticks. The properties stroke, width and size of minorTickSettings are used to customize Minor ticks in quantitative scale. Stroke specifies the color of ticks, width specifies the width of ticks and size specifies the height of the ticks.
$("#BulletGraph1").ejBulletGraph({
                    quantitativeScaleSettings: {
                        minorTickSettings: {
                            size: 7,
                            width: 3,
                            stroke: 'gray'
                        }
                    },
                });
The following screenshot displays Bullet Graph with customized Minor ticks in quantitative scale
Tick position
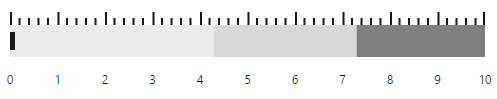
Ticks are positioned below, above or inside the quantitative scale. By default ticks are positioned below the quantitative scale. The tickPosition property is used to customize the position of ticks in quantitative scale. Ticks can be placed inside the quantitative scale by setting tickPosition to cross.
$("#BulletGraph1").ejBulletGraph({
                    quantitativeScaleSettings: {
                        tickPosition: 'above'
                    },
                });
The following screenshot displays Bullet Graph with ticks positioned above quantitative scale
Tick Placement
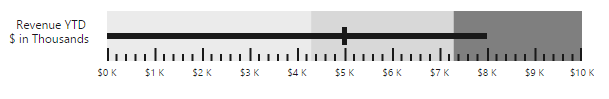
Quantitativescaleticks can be placed either inside or outside the scale using tick placement property. By default ticks are placed outside the scale.
$("#BulletGraph1").ejBulletGraph({
value: 8,
comparativeMeasureValue: 5,
qualitativeRangeSize: 50,
quantitativeScaleSettings: {
location: { x: 108, y: 10 },
tickPlacement: 'inside',
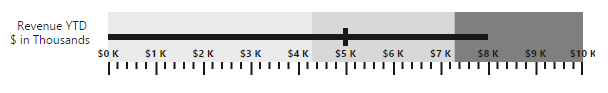
labelSettings: { offset: 5, size: 10, labelPrefix: '$', labelSuffix: ' K' },
},
captionSettings: {
textAngle: 0, location: { x: 17, y: 28 }, text: "Revenue YTD",
subTitle: {
textAngle: 0,
text: "$ in Thousands", location: { x: 10, y: 42 }
}
}
});The following screenshot displays Bullet Graph ticks inside Quantitative Scale
Quantitative scale labels
Quantitativescalelabels are customized with prefix, suffix, font, color and size using labelSettings property. Following customization options are available in labelSettings.
-
You can place the label inside or outside of the bullet graph using
label placementproperty. -
Prefix and suffix to the label is added with
label prefixandlabel suffixproperty. -
You can specify the horizontal or vertical padding of the labels using
offsetproperty. -
You can position the label either above or below the bulletgraph by using
positionproperty. -
To specify the size of the label text, you can use
sizeproperty. -
You can customize the color the labels using
strokeproperty. -
Using
fontoption in the label settings, you can customize thefont family,font style,font weightandopacityof the label text.
$("#BulletGraph1").ejBulletGraph({
quantitativeScaleSettings: {
labelSettings: {
stroke: 'blue',
labelPrefix: '$',
labelSuffix: 'K',
font: {
fontFamily: 'Segoe UI',
fontStyle: 'bold',
fontWeight: 'regular',
opacity: 0.8
},
size: 12,
offset: 15
}
},
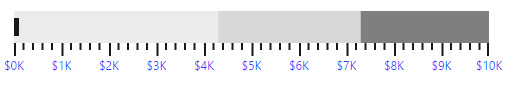
});The following screenshot displays Bullet Graph labels in blue color
Label Placement
Quantitativescalelabels can be placed either inside or outside the scale using “labelPlacement” property. By default labels are placed 15 pixels outside the scale.
$("#BulletGraph1").ejBulletGraph({
                value: 8,
                comparativeMeasureValue: 5,
                qualitativeRangeSize: 50,
                quantitativeScaleSettings: {
                    location: { x: 108, y: 10 },
                    labelSettings: {
                        offset: 5, size: 10, labelPrefix: '$', labelSuffix:            ' K', font: { fontWeight: 'bold' },
                        labelPlacement: 'inside'
                    },
                },
                captionSettings: {
                    textAngle: 0, location: { x: 17, y: 28 }, text: "Revenue YTD",
                    subTitle: {
                        textAngle: 0,
                        text: "$ in Thousands", location: { x: 10, y: 42 }
                    }
                }
           });
The following screenshot displays Bullet Graph labels inside Quantitative Scale.
Performance measure bar
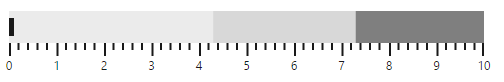
Performance measure bar is customized using featuredMeasureSettings in quantitativeScaleSettings property. Color of the bar is customized using stroke property and width using width property. By default bar is drawn in black color with 6 pixels of width.
$("#BulletGraph1").ejBulletGraph({
value: 5,
quantitativeScaleSettings: {
featuredMeasureSettings: {
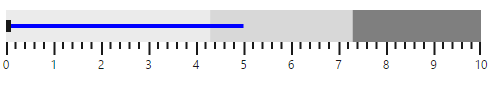
stroke: 'blue',
width: 4
},
},
});The following screenshot displays Bullet Graph with customized Performance measure bar.
Comparative measure symbol
Comparative symbol color and width are customized using comparativeMeasureSettings through quantitativeScaleSettings property. Color of the symbol is customized using stroke property and width using width property. By default Comparative measure symbol is displayed in black color with a width of 5 pixels.
$("#BulletGraph1").ejBulletGraph({
comparativeMeasureValue: 5,
quantitativeScaleSettings: {
comparativeMeasureSettings: {
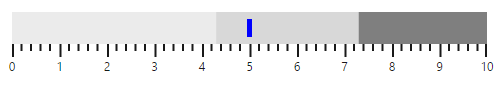
stroke: 'blue',
width: 5
},
},
});The following screenshot displays Bullet Graph with customized Comparative measure value.
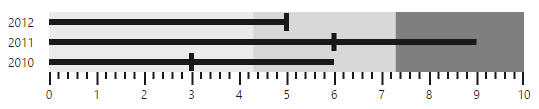
Multiple performance measures comparison
Bullet Graph supports comparing more than one performance at a time, given that all the comparisons are related using featureMeasure in quantitativeScaleSettings property. In feature measures, you can specify category, comparative measure value and value properties that are used to comparing performance.
The following screenshot displays Bullet Graph that compares 3 related performance measures.