How can I help you?
Getting started
This section explains briefly about how to create a Diagram control in your application with Aurelia.
Initialize Diagram
- To create Syncfusion Aurelia application refer [Aurelia Getting Started documentation](https://help.syncfusion.com/aurelia/overview#getting-started “”).
- Create
diagramfolder insidesrc/sampleslocation. - Create
diagram.htmlfile insidesrc/samples/diagramfolder and use the below code for rendering Diagram component
<!DOCTYPE html>
<template>
     <ej-diagram e-width="100%" e-height="600px">
        </ej-diagram>
</template>- Create
diagram.jsfile insidesrc/samples/diagramfolder with below code snippet.
export class Diagram {
constructor() {}
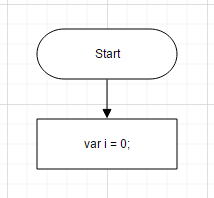
}This creates an empty diagram as shown in image
Populate Diagram with nodes and connectors
-
This section explains how to populate JSON data to the Diagram.
-
The Diagram is rendered based on default
widthandheight. You can also customize the Diagram dimension by setting thewidthandheightattribute inscrollSettings.
<!DOCTYPE html >
<template>
     <ej-diagram e-width="100%" e-height="600px" e-nodes.bind="nodes"
         e-connectors.bind="connectors" >
    </ej-diagram>
</template>export class BasicUse {
constructor() {
let margin = { 'left': 20, 'top': 0, 'right': 20, 'bottom': 0 };
this.nodes = [
{name: "Start",offsetX: 300,offsetY: 50,width: 140,height: 50,labels: [{text: "Start"}],type: "flow",shape: "terminator"},
{name: "Init",offsetX: 300,offsetY: 140,width: 140,height: 50,labels: [{text: "var i = 0;"}],type: "flow",shape: "process"}];
this.connectors = [
{ name: 'connector1', sourceNode: 'Start', targetNode: 'Init' }];
}
}
Business object (Employee information)
- Define Employee Information as JSON data. The following code example shows an employee array whose,
-
Nameis used as a unique identifier and -
ReportingPersonis used to identify the person to whom an employee report to, in the organization.
-
let data = [
	{ Name: "Elizabeth", Role: "Director" },
	{ Name: "Christina", ReportingPerson: "Elizabeth", Role: "Manager" },
	{ Name: "Yoshi", ReportingPerson: "Christina", Role: "Lead" },
	{ Name: "Philip", ReportingPerson: "Christina", Role: "Lead" },
	{ Name: "Yang", ReportingPerson: "Elizabeth", Role: "Manager" },
	{ Name: "Roland", ReportingPerson: "Yang", Role: "Lead" },
	{ Name: "Yvonne", ReportingPerson: "Yang", Role: "Lead" }
];
Map data source
-
You can configure this “Employee Information” with Diagram, so that the node and connector are automatically generated using mapping properties. DefaultSettings can define the default appearance of node and connector.
-
The NodeTemplate is used to update each node based on employee data.
-
The following code examples show how dataSourceSetting is used to map id and parent with property name identifiers for employee information.
<!DOCTYPE html>
<template>
    <ej-diagram id="diagram" e-height="450px"
                e-layout.bind="layout"
                e-default-settings.bind="defaultSettings"
                e-data-source-settings.bind="dataSourceSettings"
                e-node-template.bind="nodeTemplate">
    </ej-diagram>
</template>export class OrganizationalChart {
constructor() {
var codes = {
Director: "rgb(0, 139,139)",
Manager: "rgb(30, 30,113)",
Lead: "rgb(0, 100,0)"
}
function nodeTemplate(diagram, node) {
node.labels[0].text = node.Name;
node.fillColor = codes[node.Role];
}
this.layout = {type: "organizationalchart", orientation: "toptobottom", horizontalSpacing: 25, verticalSpacing: 35, marginX: 3, marginY: 3 };
this.defaultSettings = {
node: { constraints: ej.datavisualization.Diagram.NodeConstraints.Select | ej.datavisualization.Diagram.NodeConstraints.PointerEvents, width: 100, height: 40, borderColor: "black", labels: [{ fontColor: "#ffffff" }] },
connector: {
lineColor: "#000000", segments: [{ type: "orthogonal" }], targetDecorator: { shape: "none" },
constraints: ej.datavisualization.Diagram.ConnectorConstraints.None
}
};
this.nodeTemplate = nodeTemplate;
this.dataSourceSettings = {
id: "Name", parent: "ReportingPerson", dataSource: data
};
}}- The Employee details are displayed in the Diagram as follows.
