Having trouble getting help?
Contact Support
Contact Support
#Legend
##Legend Visibility
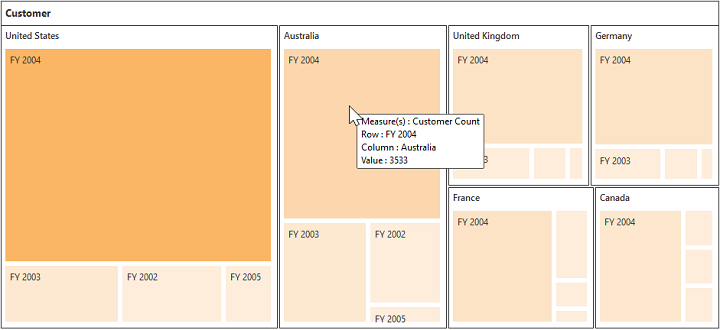
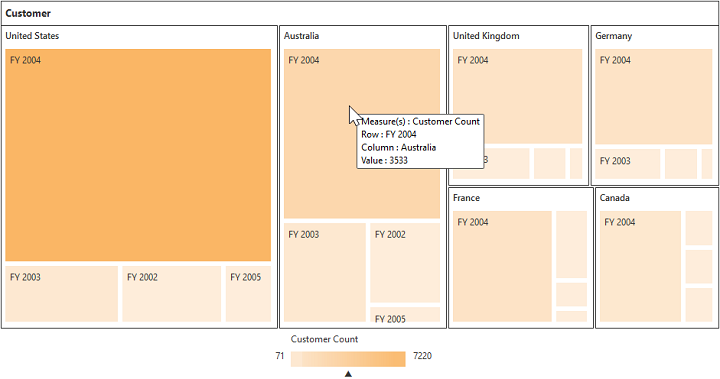
The legend shows the value range differences and color occurrence in the respective leaf node while you hover it with the cursor.
NOTE
By default, the legend is visible in PivotTreeMap.
You can disable the legend by setting the property showLegend as false. The following code example shows how to disable the legend.
<body>
    <div ng-controller="PivotTreeMapCtrl">
        <div id="PivotTreeMap1" ej-pivottreemap e-dataSource="dataSource" e-renderSuccess= "showLegend"></div>
        <!--Tooltip labels can be localized here-->
        <script id="tooltipTemplate" type="application/jsrender">
            <div style="background:White; color:black; font-size:12px; font-weight:normal; border: 1px solid #4D4D4D; white-space: nowrap;border-radius: 2px; margin-right: 25px; min-width: 110px;padding-right: 5px; padding-left: 5px; padding-bottom: 2px ;width: auto; height: auto;">
                <div>Measure(s) : </div><div>Row : </div><div>Column : </div><div>Value : </div>
            </div>
        </script>
    </div>
    <script>
        angular.module('PivotTreeMapApp', ['ejangular']).controller('PivotTreeMapCtrl', function ($scope) {
            $scope.dataSource = {
                data: "http://bi.syncfusion.com/olap/msmdpump.dll;Locale identifier=1033;", //data
                catalog: "Adventure Works DW 2008 SE",
                cube: "Adventure Works",
                ///...
            };
            $scope.showLegend = function(args){
				pivotTreeMap = $("#PivotTreeMap1TreeMapContainer").data("ejTreeMap");
                pivotTreeMap.model.showLegend = false;
                pivotTreeMap.refresh();
			  }
        });
    </script>
</body>