Getting Started
20 Jul 20178 minutes to read
This section helps to get started of the HeatMap component for Angular.0.
Adding Script Reference
Create an HTML page and add the scripts references in the order mentioned in the following code example.
<!DOCTYPE html>
<html>
   <head>
    <link href="//cdn.syncfusion.com/14.3.0.49/js/web/flat-azure/ej.web.all.min.css" rel="stylesheet" />
    <script src="node_modules/core-js/client/shim.min.js"></script>
    <script src="node_modules/zone.js/dist/zone.js"></script>
    <script src="node_modules/reflect-metadata/Reflect.js"></script>
    <script src="node_modules/systemjs/dist/system.src.js"></script>
    <script src="https://code.jquery.com/jquery-3.0.0.min.js"></script>
    <script src="http://cdn.syncfusion.com/js/assets/external/jsrender.min.js" type="text/javascript"></script>
    <script src="https://ajax.aspnetcdn.com/ajax/jquery.validate/1.14.0/jquery.validate.min.js">
    </script>
    <script src="http://cdn.syncfusion.com/14.3.0.49/js/web/ej.web.all.min.js" type="text/javascript"></script>
    <script src ="http://cdn.syncfusion.com/14.3.0.49/js/common/ej.angular2.min.js"></script>
    <script src="systemjs.config.js"></script>
  </head>
  <body>
   <ej-app>Loading...</ej-app>
  </body>
</html>
In the above code, ej.web.all.min.jsscript reference has been added for demonstration purpose. It is not recommended to use this for deployment purpose, as its file size is larger since it contains all the widgets. Instead, you can useCSGutility to generate a custom script file with the required widgets for deployment purpose.
Initialize HeatMap
The HeatMap can be created from a HTML ‘div’ element. To create the HeatMap, you should call the ‘ejHeatMap’ jQuery plug-in function.
<div>
    <ej-heatmap id="HeatMap" [width]="100%" [height]="600px">
    </ej-heatmap>
</div>import {Component} from '@angular/core';
import {CORE_DIRECTIVES, FORM_DIRECTIVES} from '@angular/common';
import {EJ_HEATMAP_COMPONENTS} from 'ej/heatmap.component';
@Component({
selector: 'sd-home',
templateUrl: 'app/components/heatmap/default.component.html',
directives: [EJ_HEATMAP_COMPONENTS, CORE_DIRECTIVES]
})
export class DefaultComponent {
}Prepare and Populate data
Populate product information in a collection called ItemsSource.
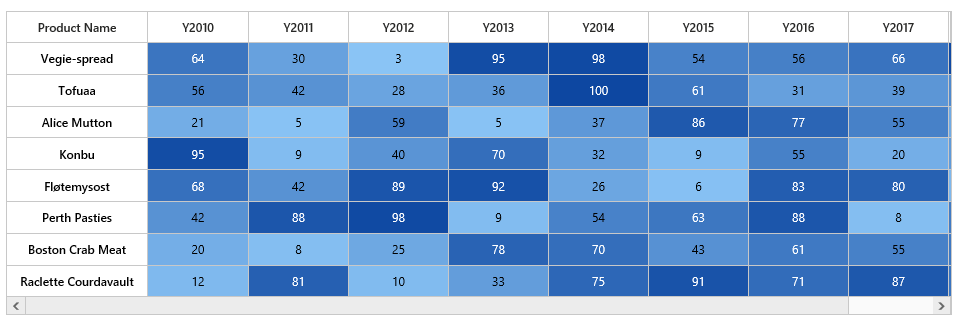
Map data into HeatMap
Now data is ready, next we need to configure data source and map rows and columns to visualize. For that, need to prepare ItemsMapping add it in resource and set items source and mapping.
Next we can configure color range for these values using color mapping and also configure items mapping based on items source.
<div>
<ej-heatmap id="heatmap1" isResponsive="true" [width]="900" [itemsMapping]="itemsMapping" [itemsSource]="itemsSource">
	<e-colormappingcollection>
		<e-colormapping [value]="0" color="#8ec8f8" [label]="label">
		</e-colormapping>
		<e-colormapping [value]="100" color="#0d47a1" [label]="label">
		</e-colormapping>
    </e-colormappingcollection>
</ej-heatmap>
</div>import {Component} from '@angular/core';
import {CORE_DIRECTIVES, FORM_DIRECTIVES} from '@angular/common';
import {EJ_HEATMAP_COMPONENTS} from 'ej/heatmap.component';
@Component({
selector: 'sd-home',
templateUrl: 'app/components/heatmap/default.component.html',
directives: [EJ_HEATMAP_COMPONENTS, CORE_DIRECTIVES]
})
export class HeatMapComponent {
margin: Object;
itemsSource: Array<Object>;
itemsMapping: Object;
label: Object;
constructor() {
this.margin = { "left": 25, "right": 25 };
var itemsSource = [];
var rows = ["Vegie-spread", "Tofuaa", "Alice Mutton", "Konbu", "Fløtemysost", "Perth Pasties", "Boston Crab Meat", "Raclette Courdavault"];
for (var i = 0; i < 8; i++) {
itemsSource.push({
ProductName: rows[i], Y2010: Math.floor((Math.random() * 100) + 1), Y2011: Math.floor((Math.random() * 100) + 1), Y2012: Math.floor((Math.random() * 100) + 1), Y2013: Math.floor((Math.random() * 100) + 1),
Y2014: Math.floor((Math.random() * 100) + 1), Y2015: Math.floor((Math.random() * 100) + 1), Y2016: Math.floor((Math.random() * 100) + 1), Y2017: Math.floor((Math.random() * 100) + 1), Y2018: Math.floor((Math.random() * 100) + 1)
});
}
this.itemsSource = itemsSource;
this.itemsMapping = {
headerMapping: { "propertyName": "ProductName", "displayName": "Product Name", columnStyle: { width: 140, textAlign: "right" } },
columnMapping: [
{ "propertyName": "Y2010", "displayName": "Y2010" },
{ "propertyName": "Y2011", "displayName": "Y2011" },
{ "propertyName": "Y2012", "displayName": "Y2012" },
{ "propertyName": "Y2013", "displayName": "Y2013" },
{ "propertyName": "Y2014", "displayName": "Y2014" },
{ "propertyName": "Y2015", "displayName": "Y2015" },
{ "propertyName": "Y2016", "displayName": "Y2016" },
{ "propertyName": "Y2017", "displayName": "Y2017" },
{ "propertyName": "Y2018", "displayName": "Y2018" }
]
}
this.label = { "text": "0" };
}
}
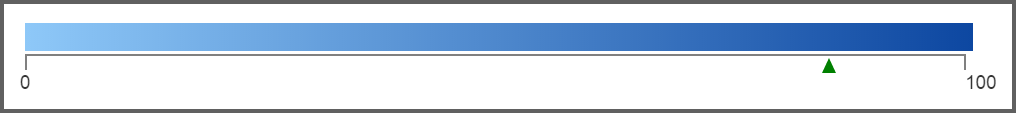
Initialize Legend
A legend control is used to represent range value in a gradient, create a legend with the same color mapping as shown below.
<div>
    <ej-heatmaplegend id="heatmaplegend" style="margin-left:200px" height="50px" width="500px" >
        <e-legendcolormappings>
            <e-legendcolormapping [value]="0" color="#8ec8f8">
            </e-legendcolormapping>
            <e-legendcolormapping [value]="100" color="#0d47a1">
            </e-legendcolormapping>
        </e-legendcolormappings>
    </ej-heatmaplegend>
</div>import {Component} from '@angular/core';
import {CORE_DIRECTIVES, FORM_DIRECTIVES} from '@angular/common';
import {EJ_HEATMAP_COMPONENTS} from 'ej/heatmap.component';
import {EJ_HEATMAPLEGEND_COMPONENTS} from 'ej/heatmaplegend.component';
@Component({
selector: 'sd-home',
templateUrl: 'app/components/heatmap/default.component.html',
directives: [EJ_HEATMAP_COMPONENTS, CORE_DIRECTIVES, EJ_HEATMAPLEGEND_COMPONENTS]
})
export class HeatMapComponent {
legendLabel: Object;
constructor() {
this.legendLabel = { "text": "0" };
}
}