Overview
8 Jan 20251 minute to read
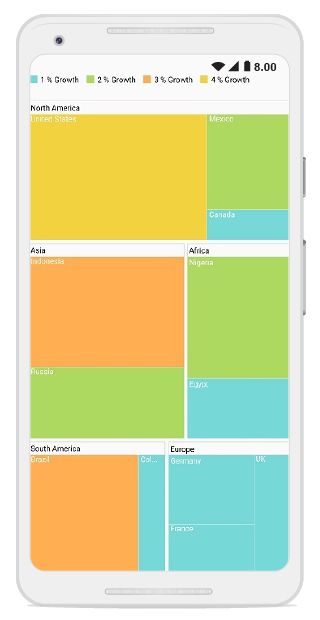
The TreeMap control provides a simple yet effective way to visualize flat or hierarchical data as clustered rectangles with a specific weighted attribute that determines the size of the rectangle.
Key features
-
Level- Defines the levels for flat and hierarchical data collections. -
Layout- Determines the visual representation of nodes belonging to all the levels in TreeMap using the layouts such as Squarified, SliceAndDiceAuto, SliceAndDiceHorizontal, and SliceAndDiceVertical. -
Visualization for colors– Customizes the colors of the leaf nodes in TreeMap using color mapping support. -
Tooltip– Provides a pop-up like information on tapping the leaf nodes. -
Selection– Allows you to select or highlight specific leaf nodes. -
Legend– Helps you to relate data with the leaf nodes. -
DataLabel– Shows the group path information on the leaf node with Trim, Wrap, and Hide options. -
Drilldown– Allows you to explore each level of data in detail by virtualizing a large set of data into minimal views.